By ETFGI
ETFGI, a leading independent research and consultancy firm covering trends in the global ETFs and ETPs ecosystem, reported on June 16, 2021, that assets invested in the global ETFs and ETPs industry broke through the US$ 9 trillion milestone at the end of May 2021. ETFs and ETPs listed globally gathered net inflows of US$97.08 billion during May, bringing year-to-date net inflows to a record US$559.48 billion which is higher than the prior record of US$229.34 billion gathered at this point last year. Assets invested in the global ETFs and ETPs industry increased by 2.8% from US$8.96 trillion at the end of April 2021, to a record US$9.21 trillion at the end of May, according to ETFGI’s May 2021 Global ETFs and ETPs industry landscape insights report, the monthly report which is part of an annual paid-for research subscription service. (All dollar values in USD unless otherwise noted.)
Highlights
- Assets invested in the global ETFs and ETPs industry break through the $9 trillion milestone.
- Record $9.21 trillion invested in ETFs and ETPs listed globally at the end of May.
- Record YTD net inflows of $559.48 Bn beating the prior record of $229.34 Bn gathered YTD in 2020.
- 24 consecutive months of net inflows into global ETFs and ETPs
- Equity ETFs and ETPs attracted the majority of net inflows in May and YTD.
“The S&P 500 gained 0.7% in May and 12.62% YTD, with positive figures for four consecutive months. Developed markets ex-U.S. gained 3.11% in May. Austria 8.29% and Luxembourg 8.12% were the leaders for the month while New Zealand lost the most at 3.92%. Emerging markets were up 2.58% at the end of May. Hungary (up 15.54%) and Poland (up 13.98%) were the leaders, whilst Egypt (down 3.86%), Chile (down 3.64%), and Malaysia (down 2.79%) were down the most,” according to Deborah Fuhr, managing partner, founder and owner of ETFGI.
Global ETF and ETP assets as of the end of May 2021
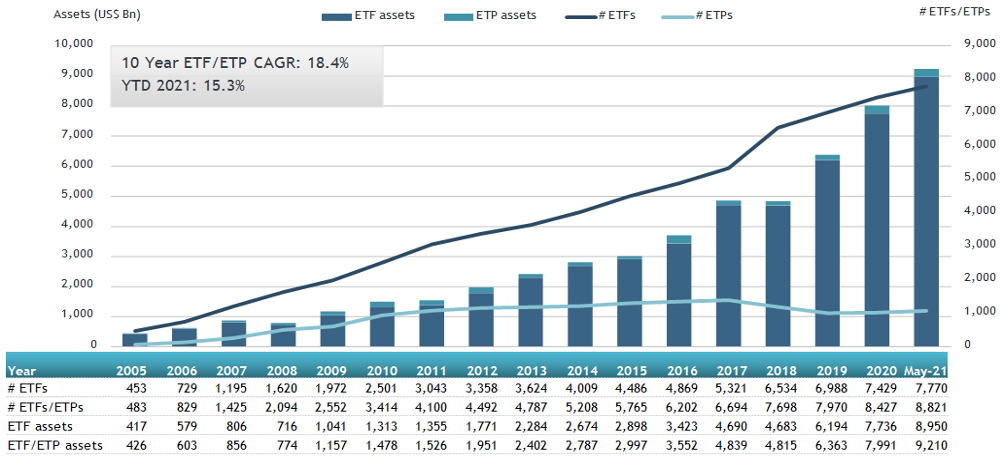
The Global ETFs and ETPs industry had 8,821 products with 17,920 listings, assets of $9.210 trillion, from 550 providers listed on 78 exchanges in 63 countries at the end of May.
During May, ETFs and ETPs gathered net inflows of $97.08 Bn. Equity ETFs/ETPs listed globally gathered net inflows of $63.06 Bn in May, bringing net inflows for 2021 to $396.94 Bn, which is much greater than the $72.91 Bn in net inflows equity products attracted YTD in 2020. Fixed Income ETFs/ETPs listed globally reported net inflows of $20.66 Bn during May, bringing net inflows for 2021 to $85.69 Bn, higher than the $65.86 Bn in net inflows fixed income products attracted YTD in 2020. Commodity ETFs/ETPs listed globally gathered net inflows of $3.83 Bn, bringing net outflows for 2021 to $3.59 Bn, significantly lower than the $48.93 Bn in net inflows commodity products had attracted over the same period in 2020. Active ETFs/ETPs reported $12.08 Bn in net inflows, bringing net inflows for 2021 to $74.03 Bn, significantly higher than the $19.47 Bn in net inflows active products attracted YTD in 2020.
Substantial inflows can be attributed to the top 20 ETFs by net new assets, which collectively gathered $35.37 Bn during May. Vanguard S&P 500 ETF (VOO US) gathered $3.58 Bn the largest individual net inflow.
Top 20 ETFs by net new inflows May 2021: Global
| Name | Ticker | Assets (US$ Mn) May 21 | NNA (US$ Mn) YTD-21 | NNA (US$ Mn) May-21 |
|---|---|---|---|---|
| Vanguard S&P 500 ETF | VOO US | 225,706.38 | 24,178.69 | 3,576.05 |
| Vanguard Total Stock Market ETF | VTI US | 243,653.31 | 16,853.58 | 2,703.27 |
| Hwabao WP Cash Tianyi Listed Money Market Fund | 511990 CH | 29,302.37 | 10,938.94 | 2,653.93 |
| iShares Core MSCI EAFE ETF | IEFA US | 96,942.43 | 3,825.55 | 2,103.42 |
| JPMorgan BetaBuilders Europe ETF | BBEU US | 8,616.93 | 4,564.37 | 2,077.81 |
| Vanguard Value ETF | VTV US | 81,905.63 | 8,988.94 | 2,026.87 |
| Vanguard Short-Term Bond ETF | BSV US | 34,132.40 | 4,774.76 | 1,884.66 |
| Huatai-Pinebridge CSI 300 ETF | 510300 CH | 8,852.29 | 1,352.41 | 1,850.41 |
| Financial Select Sector SPDR Fund | XLF US | 44,835.00 | 11,151.17 | 1,587.63 |
| iShares Global Financials ETF | IXG US | 2,669.70 | 2,195.59 | 1,584.87 |
| Health Care Select Sector SPDR Fund | XLV US | 27,714.79 | (60.59) | 1,583.26 |
| Invesco S&P 500 Equal Weight ETF | RSP US | 28,680.03 | 6,678.31 | 1,550.49 |
| iShares Commodities Select Strategy ETF | COMT US | 2,059.02 | 1,755.12 | 1,344.38 |
| Vanguard FTSE Europe ETF | VGK US | 18,941.27 | 2,495.98 | 1,329.83 |
| Vanguard Real Estate ETF | VNQ US | 39,986.46 | 3,281.29 | 1,312.81 |
| Yuanta/P-shares Taiwan Top 50 ETF | 0050 TT | 6,205.31 | 1,423.54 | 1,295.84 |
| Materials Select Sector SPDR Trust | XLB US | 9,733.26 | 3,258.06 | 1,242.23 |
| iShares Core Total USD Bond Market ETF | IUSB US | 13,967.88 | 8,168.36 | 1,236.31 |
| iShares TIPS Bond ETF | TIP US | 28,405.49 | 1,914.97 | 1,223.17 |
| Vanguard Total Bond Market ETF | BND US | 75,150.70 | 9,498.59 | 1,200.35 |
Source: ETFGI data sourced from ETF/ETP sponsors, exchanges, regulatory filings, Thomson Reuters/Lipper, Bloomberg, publicly available sources and data generated in-house. Note: This report is based on the most recent data available at the time of publication. Asset and flow data may change slightly as additional data becomes available.
The top 10 ETPs by net new assets collectively gathered $4.41 Bn over May. SPDR Gold Shares (GLD US) gathered $1.57 Bn the largest individual net inflow.
Top 10 ETPs by net new inflows May 2021: Global
| Name | Ticker | Assets (US$ Mn) May 21 | NNA (US$ Mn) YTD-21 | NNA (US$ Mn) May-21 |
|---|---|---|---|---|
| SPDR Gold Shares | GLD US | 62,558.36 | (7,037.55) | 1,570.75 |
| iShares Physical Gold ETC – Acc | SGLN LN | 14,452.86 | 118.42 | 510.09 |
| Invesco Physical Gold ETC – Acc | SGLD LN | 13,694.89 | (289.59) | 383.03 |
| Xtrackers IE Physical Gold ETC Securities – Acc | XGDU LN | 1,924.67 | 1,557.26 | 365.52 |
| Xetra Gold EUR – Acc | 4GLD GY | 14,211.72 | 881.16 | 343.94 |
| iShares Gold Trust | IAU US | 30,570.66 | (1,305.46) | 295.95 |
| AMUNDI PHYSICAL GOLD ETC (C) – Acc | GOLD FP | 3,850.60 | 541.05 | 286.79 |
| iShares Silver Trust | SLV US | 15,927.55 | 671.52 | 263.40 |
| Xtrackers IE Physical Gold ETC Securities – EUR Hdg Acc | XGDE GY | 776.16 | 581.29 | 223.15 |
| Invesco DB Commodity Index Tracking Fund | DBC US | 2,484.20 | 734.97 | 164.59 |
Source: ETFGI data sourced from ETF/ETP sponsors, exchanges, regulatory filings, Thomson Reuters/Lipper, Bloomberg, publicly available sources and data generated in-house. Note: This report is based on the most recent data available at the time of publication. Asset and flow data may change slightly as additional data becomes available.
Investors have tended to invest in Equity ETFs and ETPs during May.
Contact [email protected] if you have any questions or comments on the press release or ETFGI events, research or consulting services.
Contact [email protected] for any questions or corrections.