No one can deny that artificial intelligence (AI) is a rising industry. While generative text and art programs may currently be the most popular form of AI, self-driving cars, robotic surgeons and financial recognition software all utilize artificial intelligence, and demands for AI are growing by the day.
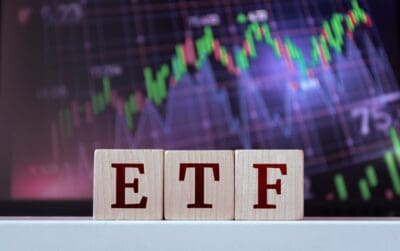
AI is rapidly changing dozens of fields, from healthcare and marketing to defense and oil exploration. This change is an enormous opportunity to invest at the ground level. But rather than attempting to identify which individual stocks have the best chances of experiencing explosive share appreciation, investors can gain exposure to the broad industry through numerous AI-themed exchange-traded funds (ETFs) that reduce concentration risk while providing sizable returns.
This comprehensive guide dives into the 20 best AI ETFs, offering you a meticulously curated list to consider for your investment portfolio. There are dozens of AI ETFs available, but 24/7 Wall Street has carefully vetted and compiled the best for your review. We considered factors like expense ratios, assets under management (AUM), holdings, diversification and growth. The following list is organized from the most speculative ETFs to those we highly recommended.
Always be sure to conduct your own due diligence before entering a trade — some of these ETFs may be better suited for investors with higher risk tolerances or strategies that align with shorter time horizons.
Key Insights from 24/7 Wall St.
- According to Grand View Research, the AI market is forecast to grow by a compound annual growth rate (CAGR) of 36.6% from 2024 to 2030. Tech companies that have leaned heavily into AI have seen their stocks driving the majority of the market’s gains over the past few years.
- Meanwhile, ETFs have experienced a CAGR of 19.8% since 2008, per State Street data. And according to PricewaterhouseCoopers, the global AUM for ETFs could reach $20 trillion by 2026, representing a CAGR of 17%.
- Now may be the time to review your retirement plan with a top-notch financial advisor. Click here to find out more.
20. Direxion Daily Robotics, Artificial Intelligence & Automation Index Bull 2X Shares (UBOT)

The Direxion Daily Robotics, Artificial Intelligence & Automation Index Bull 2X Shares (UBOT) seeks daily investment results, before fees and expenses, of 200% of the performance of the Indxx Global Robotics and Artificial Intelligence Thematic Index. Leveraged ETFs are higher-risk equities that provide 1x, 2x and sometimes 3x the gains and the losses of an underlying benchmark index. The ETF has $29.86 million in AUM and an expense ratio of 1.38%.
Since its inception on April 20, 2018, UBOT has lost -52.02% compared to the S&P 500’s gain of 119.07% over the same period.

Here are the current top 15 holdings in the Direxion Daily Robotics, Artificial Intelligence & Automation Index Bull 2X Shares:
| Ticker | Holding’s Name | % of Net Assets | Market Value |
| NVDA | Nvidia | 11.89% | $3,550,354 |
| ISRG | Intuitive Surgical | 9.86% | $2,944,196 |
| ABBN | Abb Ltd. | 9.72% | $2,902,392 |
| KYCCF | Keyence | 7.91% | $2,361,926 |
| SMC | Summit Midstream Corp. | 5.72% | $1,707,992 |
| DT | Dynatrace Inc. | 4.70% | $1,403,342 |
| FANUY | Fanuc | 4.37% | $1,304,882 |
| YASKY | Yaskawa Electric | 3.72% | $1,110,792 |
| DFKCY | Daifuku | 3.26% | $973,436 |
| CGNX | Cognex | 3.10% | $925,660 |
| PEGA | Pegasystems | 2.73% | $815,178 |
| AVAV | Aerovironment | 2.51% | $749,486 |
| PATH | Uipath Inc. | 2.35% | $701,710 |
| TECN | Tecan Hld. | 1.88% | $561,368 |
| PRCT | Procept Biorobotics Shares | 1.80% | $537,480 |
19. ERShares Entrepreneur Private-Public Crossover ETF (XOVR)

Formerly with the ticker ENTR, the ERShares Entrepreneur Private-Public Crossover ETF (XOVR) was rebranded on Aug. 29, 2024. The fund’s strategy remains the same: Choosing 30 of the most entrepreneurial, primarily U.S. large cap companies that meet the threshold for ERShares’ proprietary Entrepreneur Factor. XOVR is a crossover ETF, meaning that it enables institutional, retail and high net worth investors to invest in both public and private equity securities (e.g. SpaceX, Open AI, etc.). The ETF is benchmarked to the ER30TR Index, has $107.20 in AUM and an expense ratio of 0.75%.
Since its relaunch date on Aug. 29, 2024, ENTR has gained 27.88% compared to the S&P 500’s gain of 62.23% over the same period.

Here are the current top 15 holdings in the ERShares Entrepreneur Private-Public Crossover ETF:
| Ticker | Holding’s Name | Shares | % of Net Assets | Market Value |
| APP | Applovin Corp. | 23,988 | 6.51% | $7,704,705 |
| NVDA | Nvidia | 51,140 | 6.35% | $7,518,091 |
| GOOGL | Alphabet | 10,225 | % | $6,762,147 |
| META | Meta Platforms | 29,264 | % | $5,737,145 |
| ORCL | Oracle Corp. | 29,264 | % | $5,527,969 |
| CRM | Salesforce Inc. | 16,194 | % | $5,237,625 |
| CRWD | Crowdstrike Holdings Inc. | 12,572 | % | $4,441,561 |
| DASH | DoorDash Inc. | 24,234 | % | $4,269,546 |
| TOST | Toast Inc. | 97,312 | % | $4,135,760 |
| ANET | Arista Networks | 10,590 | % | $3,999,843 |
| SNPS | Synopsys Inc. | 7,392 | % | $3,947,475 |
| HOOD | Robinhood | 111,540 | % | $3,930,669 |
| UI | Ubiquiti | 11,109 | % | $3,821,384 |
| ABNB | Airbnb | 28,910 | % | $3,799,930 |
| CPRT | Copart | 64,463 | % | $3,643,448 |
18. Roundhill Generative AI & Technology ETF (CHAT)

As the world’s first generative AI ETF, the Roundhill Generative AI & Technology ETF (CHAT) is an actively-managed ETF with $215 million in AUM, 49 holdings, 5,400,000 shares outstanding and an expense ratio of 0.75%.
Since its inception on May 18, 2023, CHAT has gained 53.16% compared to the S&P 500’s gain of 40.95% over the same period.

Here are the current top 15 holdings in the Roundhill Generative AI & Technology ETF:
| Ticker | Holding’s Name | Shares | % of Net Assets | Market Value |
| NVDA | Nvidia | 112,827 | 7.67% | $16,460,331 |
| GOOGL | Alphabet Inc. | 29,589 | % | $12,330,214 |
| MSFT | Microsoft Corp. | 16,426 | % | $12,269,374 |
| META | Meta Platforms | 16,426 | % | $9,289,231 |
| TSM | Taiwan Semiconductor Manufacturing | 237,030 | % | $7,479,243 |
| DELL | Dell Technologies Inc. | 55,609 | % | $7,449,381 |
| HPE | Hewlett Packard Enterprise Co. | 338,145 | % | $7,161,911 |
| PLTR | Palantir Technologies Inc. | 108,279 | % | $6,726,291 |
| AVGO | Broadcom Inc. | 40,536 | % | $6,617,502 |
| ORCL | Oracle Corp. | 34,383 | % | $6,558,557 |
| AMD | Advanced Micro Devices | 46,714 | % | $6,427,846 |
| MRVL | Marvell Technologies | 70,900 | % | $6,371,074 |
| AAPL | Apple Inc. | 26,912 | % | $6,162,848 |
| 000660 KS | SK Hynix | 48,176 | % | $5,908,361 |
| ANET | Arista Networks Inc. | 15,186 | % | $5,796,648 |
17. VanEck Social Sentiment ETF (BUZZ)

The VanEck Social Sentiment ETF (BUZZ) aims to track the price performance and yield of the BUZZ NextGen AI US Sentiment Leaders Index (BUZZTR), which is intended to track the performance of the 75 large cap U.S. stocks which exhibit the highest degree of positive investor sentiment and bullish perception based on content aggregated from online sources including social media, news articles, blog posts and other alternative datasets. It has $61.04 million in AUM and 0.75% expense ratio.
Since its inception on March 2, 2021, BUZZ has gained 52% compared to the S&P 500’s gain of 31.08% over the same period.

Here are the current top 15 holdings in the VanEck Social Sentiment ETF:
| Ticker | Holding’s Name | Shares | % of Net Assets | Market Value |
| MSTR | Microstrategy Inc. | 10,847 | 6.21% | $4,670,067 |
| SOFI | Sofi Technologies Inc. | 230,376 | 4.22% | $3,322,022 |
| TSLA | Tesla Inc. | 8,322 | 3.83% | $2,879,412 |
| AMZN | Amazon.com Inc. | 45,676 | 3.82% | $2,876,674 |
| NVDA | Nvidia | 95,077 | 3.48% | $2,621,273 |
| COIN | Coinbase | 86,174 | 2.99% | $2,252,588 |
| INTC | Intel Corp. | 7,171 | 2.97% | $2,236,276 |
| COST | Costco Wholesale Corp. | 10,646 | 2.90% | $2,178,278 |
| HOOD | Robinhood | 14,751 | 2.88% | $2,168,545 |
| AAPL | Apple Inc. | 6,592 | 2.84% | $2,139,565 |
| META | Meta Platforms | 85,628 | 2.75% | $2,072,198 |
| MU | Micron Technology Inc. | 2,220 | 2.75% | $2,064,933 |
| RBLX | Roblox Corp. | 57,343 | 2.69% | $2,020,767 |
| BA | Boeing Co. | 8,678 | 2.63% | $1,981,014 |
| GOOGL | Alphabet Inc. | 3,407 | 2.54% | $1,911,634 |
16. QRAFT AI-Enhanced U.S. Large Cap Momentum ETF (AMOM)

The QRAFT AI-Enhanced U.S. Large Cap Momentum ETF (AMOM) is actively managed by AI technology and seeks to provide shareholders with capital appreciation by investing in stocks that exhibit higher price momentum. The ETF has $39,571,644 in AUM, 875,001 shares outstanding and an expense ratio of 0.75%.
Since its inception on May 21, 2019, AMOM has gained 79.99% compared to the S&P 500’s gain of 108.3% over the same period.

Here are the current top 15 holdings in the QRAFT AI-Enhanced U.S. Large Cap Momentum ETF:
| Ticker | Holding’s Name | Shares | % of Net Assets | Market Value |
| NVDA | Nvidia | 25,145 | 9.34% | $3,696,566 |
| AAPL | Apple Inc. | 14,777 | 8.52% | $3,373,293 |
| TSLA | Tesla Inc. | 9,724 | 8.50% | $3,364,504 |
| AVGO | Broadcom Inc. | 13,309 | 5.56% | $2,200,643 |
| LLY | Eli Lilly | 2,904 | 5.36% | $2,119,135 |
| NOW | ServiceNow Inc. | 1,211 | 3.13% | $1,237,763 |
| UNH | UnitedHealth Group | 1,889 | 2.75% | $1,089,953 |
| NFLX | Netflix Inc. | 1,164 | 2.56% | $1,014,216 |
| ORCL | Oracle | 5,126 | 2.45% | $968,301 |
| CTAS | Cintas | 4,431 | 2.44% | $965,825 |
| AXON | Axon Enterprise | 1,510 | 1.33% | $921,402 |
| URI | United Rentals | 946 | 1.96% | $776,817 |
| KLAC | KLA Corp. | 1,173 | 1.83% | $722,169 |
| FICO | Fair Isaac Corp. | 295 | 1.70% | $673,906 |
| AMD | Advanced Micro Devices | 4,564 | 1.61% | $636,175 |
15. Fidelity Disruptive Technology ETF (FDTX)
The actively managed Fidelity Disruptive Technology ETF (FDTX) seeks to identify innovative developments that could signal new directions for delivering products and services to customers. The ETF has $153 million in AUM, 46 holdings with a 25% quarterly turnover rate and an expense ratio of 0.50%.
Since its inception on April 16, 2020, FDTX has gained 37.59% compared to the S&P 500’s gain of 36.37% over the same period.

Here are the current top 15 holdings in the Fidelity Disruptive Technology ETF:
| Ticker | Holding’s Name | Shares | % of Net Assets |
| NVDA | Nvidia Corp. | 79,193 | 7.26% |
| TSM | Taiwan Semiconductor Manufacturing | 44,623 | 5.36% |
| MSFT | Microsoft Corp. | 19,195 | 5.01% |
| META | Meta Platforms | 12,679 | 4.97% |
| CRM | Salesforce | 26,767 | 4.79% |
| NFLX | Netflix Inc. | 8,552 | 3.96% |
| AMZN | Amazon.com Inc. | 32,453 | 3.95% |
| ADBE | Adobe Inc. | 11,388 | 3.85% |
| GOOGL | Alphabet Inc. | 35,140 | 3.84% |
| ASML | ASML Holding | 6,796 | 3.70% |
| SAP | SAP SE | 18,248 | 3.70% |
| HUBS | HubSpot Inc. | 6,320 | 2.59% |
| ATEYY | Advantest Corp. | 69,998 | 2.52% |
| PANW | Palo Alto Networks Inc. | 9,827 | 2.33% |
| INTU | Intuit Inc. | 5,127 | 2.13% |
| SNPS | Synopsys Inc. | 6,535 | 2.10% |
14. iShares U.S. Tech Independence Focused ETF (IETC)

The iShares U.S. Tech Independence Focused ETF (IETC) seeks to provide access to U.S. companies with technology exposure using a proprietary classification system. By using Big Data, the IETC selects companies that may play an essential role in the shift to a more digital economy. The ETF has $366.906 million in AUM, 119 holdings and an expense ratio of 0.18%.
Since its inception on March 21, 2018, IETC has gained 256.40% compared to the S&P 500’s gain of 124.3% over the same period.

Here are the current top 15 holdings in the iShares U.S. Tech Independence Focused ETF:
| Ticker | Holding’s Name | Shares | % of Net Assets | Market Value |
| AVGO | Broadcom Inc. | 250,985 | 11.75% | $43,121,732 |
| AMZN | Amazon.com Inc. | 136,698 | 8.38% | $30,762,517 |
| NVDA | Nvidia Corp. | 215,602 | 7.94% | $29,121,362 |
| MSFT | Microsoft Corp. | 64,969 | 7.85% | $28,802,706 |
| ACN | Accenture PLC | 42,145 | 4.17% | $15,294,420 |
| CRM | Salesforce Inc. | 41,539 | 3.95% | $14,489,633 |
| ORCL | Oracle Corp. | 67,415 | 3.27% | $11,982,342 |
| AAPL | Apple Inc. | 38,177 | 2.58% | $9,459,115 |
| GOOGL | Alphabet Inc. | 48,107 | 2.43% | $8,907,973 |
| MSI | Motorola Solutions Inc. | 17,480 | 2.27% | $8,338,309 |
| NOW | ServiceNow Inc. | 7,295 | 2.24% | $8,227,592 |
| VRSN | Verisign Inc. | 38,842 | 2.12% | $7,788,986 |
| IBM | International Business Machines Co. | 33,096 | 2.09% | $7,669,005 |
| META | Meta Platforms Inc. | 11,191 | 1.89% | $6,930,810 |
| CSCO | Cisco Systems Inc. | 114,906 | 1.84% | $6,747,280 |
13. Global X Robotics & Artificial Intelligence ETF (BOTZ)

The Global X Robotics & Artificial Intelligence ETF (BOTZ) looks to produce gains by capitalizing on the global robotics market — specifically, it aims to provide exposure to the wide-reaching applications of robotics and AI extending beyond industrial activity, by spanning multiple sectors and industries. The fund has $2.70 in AUM, 46 holdings and an expense ratio of 0.68%.
Since its inception on Sept. 12, 2016, BOTZ has gained 174.10% compared to the S&P 500’s gain of 121.50% over the same period.

Here are the current top 15 holdings in the Global X Robotics & Artificial Intelligence ETF:
| Ticker | Holding’s Name | Shares | % of Net Assets | Market Value |
| NVDA | Nvidia Corp. | 2,531,546 | 12.63% | $341,935,918 |
| ISRG | Intuitive Surgical Inc. | 519,263 | 10.32% | $279,410,227 |
| ABBN SW | ABB LTD-REG | 4,329,139 | 9.29% | $251,584,596 |
| KKYCCF | Keyence Corp. | 427,623 | 6.81% | $184,401,438 |
| SMCAY | SMC Corp. | 332,598 | 5.10% | $138,133,387 |
| DT | Dynatrace Inc. | 2,269,922 | 4.77% | $129,226,659 |
| FANUY | Fanuc ADR | 3,857,537 | 3.87% | $104,727,216 |
| DFKCY | Daifuku ADR | 4,362,938 | 3.63% | $98,372,242 |
| PEGA | Pegasystems Inc. | 963,937 | 3.35% | $90,610,078 |
| OMRNY | Omron Corp. | 2,369,233 | 2.97% | $80,425,434 |
| CGNX | Cognex Corp. | 1,971,994 | 2.76% | $74,797,732 |
| YASKY | Yaskawa Electric ADR | 2,755,723 | 2.76% | $74,723,795 |
| UPST | Upstart Holdings Inc. | 995,386 | 2.72% | $73,678,471 |
| PATH | UiPath Inc. | 4,724,961 | 2.57% | $69,504,176 |
| AI | C3.AI Inc. | 1,341,585 | 2.07% | $55,984,342 |
12. VanEck Robotics ETF (IBOT)

The VanEck Robotics ETF (IBOT) seeks to replicate as closely as possible the price and yield performance of the BlueStar Robotics Index, which tracks the overall performance of companies involved in robotics. The fund has $12.02 million in AUM, 66 holdings and expense ratio of 0.47%.
Since its inception on April 5, 2023, IBOT has gained 24.24% compared to the S&P 500’s gain of44.14% over the same period.

Here are the current top 15 holdings in the VanEck Robotics ETF:
| Ticker | Holding’s Name | Shares | % of Net Assets | Market Value |
| NVDA | Nvidia Corp. | 5,050 | 5.68% | $682,102 |
| SIEGY | Siemens AG | 3,218 | 5.52% | $662,943 |
| KKYCCF | Keyence Corp. | 1,500 | 5.37% | $645,192 |
| ABBN | ABB Ltd. | 10,932 | 5.26% | $631,416 |
| EMR | Emerson Electric Co. | 4,555 | 4.90% | $588,278 |
| ADSK | Autodesk Inc. | 1,767 | 4.47% | $537,150 |
| DSY | Dassault Systemes SE | 13,284 | 4.06% | $487,591 |
| ASML | ASML Holding NV | 591 | 3.47% | $416,815 |
| PTC | PTC Inc. | 1,690 | 2.79% | $335,212 |
| HEXAB | Hexagon AB | 32,043 | 2.62% | $315,282 |
| DNZOY | Denso ADR | 21,900 | 2.59% | $311,369 |
| ROK | Rockwell Automation Inc. | 1,048 | 2.56% | $307,798 |
| TDY | Teledyne Technologies Inc. | 630 | 2.47% | $296,743 |
| ANSS | Ansys Inc. | 796 | 2.25% | $270,401 |
| ISRG | Intuitive Surgical Inc. | 494 | 2.21% | $265,816 |
11. Themes Generative Artificial Intelligence ETF (WISE)

The Themes Generative Artificial Intelligence ETF (WISE) seeks to track the Solactive Generative Artificial Intelligence Index, which identifies 40 companies that derive their revenue from AI, data analytics, Big Data, natural language processing and AI-driven services. The fund has $15 million in AUM, 40 holdings and expense ratio of 0.35%.
Since its inception on Dec. 8, 2023, WISE has gained 24.79% compared to the S&P 500’s gain of 28.51% over the same period.

Here are the current top 10 holdings in the Themes Generative Artificial Intelligence ETF:
| Ticker | Holding’s Name | Shares | % of Net Assets | Market Value |
| SOUN | Soundhound AI Inc. | 354 | 8.62% | $1,370,351 |
| AI | C3.ai Inc. | 5.09% | $809,061 | |
| BBAI | Bigbear.ai Holdings Inc. | 4.79% | $762,376 | |
| AMZN | Amazon.com Inc. | 4.70% | $746,682 | |
| NVDA | Nvidia Corp. | 4.22% | $670,757 | |
| PATH | UiPath Inc. | 4.10% | $652,020 | |
| GDYN | Grid Dynamics Holdings Inc. | 4.06% | $645,240 | |
| GOOGL | Alphabet Inc. | 3.87% | $615,134 | |
| MSFT | Microsoft Corp. | 3.71% | $590,072 | |
| INTC | Intel Corp. | 3.47% | $552,384 |
10. Global X Artificial Intelligence & Technology ETF (AIQ)

The Global X Artificial Intelligence & Technology ETF (AIQ) spans multiple segments, with innovative companies that include household names and newcomers from around the world. The fund has $2.58 billion in AUM, 84 holdings and an expense action of 0.68%.
Since its inception on May 11, 2018, AIQ has gained 153.70% compared to the S&P 500’s gain of 116.90% over the same period.

Here are the current top 15 holdings in the Global X Artificial Intelligence & Technology ETF:
| Ticker | Holding’s Name | Shares | % of Net Assets | Market Value |
| TSLA | Tesla Inc. | 280,944 | 4.36% | $112,655,734 |
| NOW | ServiceNow Inc. | 90,488 | 3.95% | $102,055,985 |
| NFLX | Netflix Inc. | 107,906 | 3.82% | $98,555,954 |
| CRM | Salesforce Inc. | 270,584 | 3.66% | $94,385,110 |
| META | Meta Platforms Inc. | 141,776 | 3.40% | $87,804,712 |
| CSCO | Cisco Systems Inc. | 1,493,690 | 3.40% | $87,709,476 |
| IBM | International Business Machines Co. | 376,175 | 3.38% | $87,167,271 |
| ORCL | Oracle Corp. | 483,664 | 3.33% | $85,966,439 |
| AMZN | Amazon.com Inc. | 371,396 | 3.24% | $83,578,955 |
| BABA | Alibaba GRP-ADR | 909,906 | 3.17% | $81,736,855 |
| TCHEY | Tencent Holdings ADR | 1,465,043 | 3.00% | $77,477,420 |
| NVDA | Nvidia Corp. | 564,879 | 2.96% | $76,298,206 |
| AAPL | Apple Inc. | 307,591 | 2.95% | $76,211,822 |
| ACN | Accenture PLC | 209,514 | 2.94% | $76,032,630 |
| AVGO | Broadcom Inc. | 422,788 | 2.81% | $72,639,206 |
9. iShares U.S. Consumer Focused ETF (IEDI)

The iShares U.S. Consumer Focused ETF (IEDI)provides access to U.S. companies with discretionary spending explores, while targeting increased explores to U.S. companies with a greater proportion of consumer spending revenues and consumer goods and service production relative to iShares’ proprietary classification system. The fund has $28,194,015 in AUM, 178 holdings and an expense ratio of 0.18%.
Since its inception on March 21, 2018, IEDI has gained 115.40% compared to the S&P 500’s gain of 118.20% over the same period.

Here are the current top 15 holdings in the iShares U.S. Consumer Focused ETF:
| Ticker | Holding’s Name | Shares | % of Net Assets | Market Value |
| HD | Home Depot Inc. | 8,120 | 12.17% | $3,431,430 |
| AMZN | Amazon.com Inc. | 11,161 | 8.91% | $2,511,671 |
| COST | Costco Wholesale Corp. | 2,486 | 8.76% | $2,469,592 |
| WMT | Walmart Inc. | 24,038 | 8.06% | $2,272,792 |
| TJX | TJX Inc. | 10,268 | 4.63% | $1,306,089 |
| LOW | Lowe’s Companies Inc. | 4,273 | 4.09% | $1,154,180 |
| CMG | Chipotle Mexican Grill Inc. | 12,770 | 2.94% | $827,879 |
| ORLY | O’Reilly Automotive Inc. | 463 | 2.08% | $586,320 |
| ROST | Ross Stores Inc. | 3,463 | 1.91% | $539,431 |
| MCD | McDonald’s Inc. | 1,740 | 1.86% | $523,235 |
| SBUX | Starbucks Corp. | 5,031 | 1.75% | $493,842 |
| META | Meta Platforms Inc. | 781 | 1.72% | $483,688 |
| TGT | Target Corp. | 3,328 | 1.59% | $449,446 |
| HLT | Hilton Worldwide Holdings Inc. | 1,406 | 1.27% | $356,730 |
| MAR | Marriott International Inc. | 1,228 | 1.25% | $353,258 |
8. Pacer BlueStar Engineering The Future ETF (BULD)

The Pacer BlueStar Engineering The Future ETF (BULD) aims to offer investors exposure to globally listed companies and depsotirany receipts that generate at least 50% of their revenues from robotics and muafacuting automation, #d printing or computer aided design. The fund has $897,278.58 in AUM, 56 holdings and an expense ratio of 0.60%.
Since its inception on May 4, 2022, BULD has gained 9.22% compared to the S&P 500’s gain of 42.69% over the same period.

Here are the current top 15 holdings in the Pacer BlueStar Engineering The Future ETF:
| Ticker | Holding’s Name | Shares | % of Net Assets | Market Value |
| ADSK | Autodesk Inc. | 342 | 10.98% | $98,492 |
| PRLB | Proto Labs Inc. | 1,287 | 6.39% | $57,335 |
| SIEGY | Siemens AG | 253 | 5.71% | $51,260 |
| ASML | ASML Holding NIV | 70 | 5.50% | $49,368 |
| DASTY | Dassault Systemes SE | 1,342 | 5.50% | $49,311 |
| SSYS | Stratasys Ltd. | 4,485 | 5.08% | $45,567 |
| FARO | FARO Technologies Inc. | 1,596 | 4.48% | $43,411 |
| ANSS | ANYSY Inc. | 123 | 4.66% | $41,738 |
| AMAT | Applied Materials Inc. | 228 | 4.27% | $38,342 |
| RSW | Renishaw PLC | 863 | 4.15% | $37,270 |
| PTC | PTC Inc. | 155 | 3.43% | $30,744 |
| KYCCF | Keyence Corp. | 70 | 3.36% | $30,185 |
| DDD | 3D Systems Corp. | 9,031 | 3.32% | $29,802 |
| LRCX | Lam Research Corp. | 390 | 3.26% | $29,211 |
| NNDM | Nano Dimensions Ltd. | 11,957 | 3.25% | $29,175 |
7. Euclidean Fundamental Value ETF (ECML)

The Euclidean Fundamental Value ETF (ECML) specializes in machine learning with a focus on investing in companies of undervalued U.S. stocks across all sectors except for financials. The fund has $184.76 million in AUM, 63 holdings and an expense ratio of 0.95%.
Since its inception on May 17, 2023, ECML has gained 37.14% compared to the S&P 500’s gain of 40.95% over the same period.

Here are the current top 15 holdings in the Euclidean Fundamental Value ETF:
| Ticker | Holding’s Name | Shares | % of Net Assets | Market Value |
| CALM | Cal-Maine Foods Inc. | 43,974 | 2.48% | $4,580,000 |
| ALSN | Allison Transmission Holdings Inc. | 35,689 | 2.20% | $4,070,000 |
| HSII | Heidrick & Struggles International Inc. | 88,129 | 2.18% | $4,020,000 |
| MLI | Mueller Industries Inc. | 47,136 | 2.05% | $3,780,000 |
| GPI | Group 1 Automtive Inc. | 8,659 | 1.99% | $3,680,000 |
| GIII | G-III Apparel Group Ltd. | 104,101 | 1.96% | $3,630,000 |
| PRDO | Perdoceo Education Corp. | 128,562 | 1.92% | $3,540,000 |
| TOL | Toll Brothers Inc. | 23,961 | 1.89% | $3,490,000 |
| FOXA | Fox Corp. | 75,007 | 1.88% | $3,480,000 |
| VNOM | Viper Energy Inc. | 68,436 | 1.87% | $3,450,000 |
| INGR | Ingredion Inc. | 23,684 | 1.84% | $3,410,000 |
| LNG | Cheniere Energy Inc. | 15,766 | 1.82% | $3,360,000 |
| DDS | Dillard’s Inc. | 7,233 | 1.82% | $3,370,000 |
| TMHC | Taylor Morrison Home Corp. | 48,047 | 1.77% | $3,280,000 |
| PPC | Pilgrim’s Pride Corp. | 66,394 | 1.75% | $2,340,000 |
6. QRAFT AI-Enhanced U.S. Large Cap Momentum ETF (QRFT)

The QRAFT AI-Enhanced U.S. Large Cap Momentum ETF (QRFT) is optimized and actively managed by AI. The portfolio consists of U.S. large cap stocks that have proven a shift towards five factors: quality, she, value, momentum and low volatility. The fund has $13,769,403 in AUM, 350 holdings and an expense ratio of 0.75%.
Since its inception on May 21, 2019, QRFT has gained 112.80% compared to the S&P 500’s gain of 108.30% over the same period.

Here are the current top 10 holdings in the QRAFT AI-Enhanced U.S. Large Cap Momentum ETF (QRFT):
| Ticker | Holding’s Name | Shares | % of Net Assets | Market Value |
| AAPL | Apple Inc. | 5,199 | 9.36% | $1,288,156 |
| META | Meta Platforms Inc. | 1,358 | 6.11% | $841,036 |
| GOOGL | Alphabet Inc. | 4,180 | 5.62% | $744,010 |
| LLY | Eli Lilly & Co. | 593 | 3.44% | $474,150 |
| MA | Mastercard Inc. | 571 | 2.19% | $302,064 |
| NFLX | Netflix Inc. | 269 | 1.78% | $245,691 |
| JNJ | Johnson & Johnson | 1,513 | 1.64% | $225,784 |
| CRM | Salesforce Inc. | 602 | 1.53% | $208,989 |
| ABBV | AbbVie Inc. | 1,113 | 1.42% | $195,520 |
| TMUS | T-Mobile Inc. | 732 | 1.24% | $170,922 |
5. LG QRAFT AI-Powered U.S. Large Cap Core ETF (LQAI)

The LG QRAFT AI-Powered U.S. Large Cap Core ETF (LQAI) embraces a strategy that aims to leverage proprietary AI engine development to actively generate signals to analyze relative strength conviction of large cap stocks. The fund has $5,348,259 in AUM, 100 holdings and an expense ratio of 0.75%.
Since its inception on Nov. 7, 2023, LQAI has gained 36.69% compared to the S&P 500’s gain of 35.14% over the same period.

Here are the current top 10 holdings in the LG QRAFT AI-Powered U.S. Large Cap Core ETF:
| Ticker | Holding’s Name | Shares | % of Net Assets | Market Value |
| MSFT | Microsoft Corp. | 985 | 8.17% | $436,680 |
| NVDA | Nvidia Corp. | 2,634 | 6.64% | $355,774 |
| AAPL | Apple Inc. | 1,179 | 5.46% | $292,120 |
| AMZN | Amazon.com Inc. | 1,189 | 5.00% | $267,572 |
| PLTR | Palantir Technologies Inc. | 3,678 | 4.88% | $260,733 |
| TSLA | Tesla Inc. | 617 | 4.63% | $247,410 |
| GOOGL | Alphabet Inc. | 1,005 | 3.48% | $186,095 |
| JPM | JPMorgan Chase & Co. | 741 | 3.36% | $179,959 |
| META | Meta Platforms Inc. | 282 | 3.27% | $174,648 |
| AXON | Axon Enterprise Inc. | 162 | 1.93% | $103,266 |
4. ROBO Global Artificial Intelligence ETF (THNQ)

The ROBO Global Artificial Intelligence ETF (THNQ) invests in companies around the world that releasing the AI revolution, including those developing the technology and infrastructure enabling AI, such as computing data and cloud services, e-commerce, health care and more. The fund has $153,917,539 in AUM, 55 holdings and an expense ratio of 0.75%.
Since its inception on May 11, 2020,THNQ has gained 89.80% compared to the S&P 500’s gain of 101.90% over the same period.

Here are the current top 15 holdings in the ROBO Global Artificial Intelligence ETF:
| Ticker | Holding’s Name | Shares | % of Net Assets | Market Value |
| NET | Cloudflare Inc. | 37,520 | 2.71% | $4,172,224 |
| SHOP | Shopify Inc. | 35,334 | 2.60% | $4,008,642 |
| AMBA | Ambarella Inc. | 55,401 | 2.60% | $4,001,060 |
| NVDA | Nvidia Corp. | 29,517 | 2.59% | $3,986,861 |
| SNOW | Snowflake Inc. | 22,088 | 2.46% | $3,789,196 |
| DDOG | Datadog Inc. | 24,352 | 2.45% | $3,772,368 |
| CRWD | Crowdstrike Holdings Inc. | 10,594 | 2.39% | $3,673,734 |
| TSLA | Tesla Inc. | 9,075 | 2.36% | $3,638,984 |
| PSTG | Pure Storage Inc. | 59,078 | 2.31% | $3,561,812 |
| JD | JD.com Inc. | 88,492 | 2.2% | $3,501,185 |
| HUBS | Hubspot Inc. | 4,827 | 2.26% | $3,478,342 |
| PANW | Palo Alto Networks Inc. | 8,858 | 2.24% | $3,452,494 |
| ANET | Arista Networks Inc. | 32,448 | 2.21% | $3,399,901 |
| MSFT | Microsoft Corp. | 7,555 | 2.18% | $3,349,358 |
| ADSK | Autodesk inc. | 10,790 | 2.13% | $3,280,052 |
3. BTD Capital Fund (DIP)
The BTD Capital Fund (DIP) is an actively managed, large blend ETF that seeks to achieve its investment objective by investing primarily in U.S. equities securities in the S&P 500 utilizing a proprietary AI -driven algorithm that identifies equities that oversold in the market. Its motto is “buy the dip,” and it is one of the first ETFs whose daily trading activities were operated autonomously by AI. The fund has $1.13 million in AUM, 26 holdings and an expense ratio of 0.77%.
Since its inception on Dec. 12, 2022, DIP has gained 47.17% compared to the S&P 500’s gain of 30.40% over the same period.

2. Fidelity Disruptive Automation ETF (FBOT)

The Fidelity Disruptive Automation ETF (FBOT) seeks long-term growth of capital by investing in securities of disruptive automation companies. The fund has $100.34 million in AUM, 51 holdings and an expense ratio of 0.50%.
Since its inception on April 16, 2020, FBOT has gained 7.11% compared to the S&P 500’s gain of 36.37% over the same period.

Here are the current top 15 holdings in the Fidelity Disruptive Automation ETF:
| Ticker | Holding’s Name | % of Net Assets |
| TSMC | Taiwan Semiconductor Manufacturing Co. Ltd. | 6.42% |
| PTC | PTC Inc. | 5.68% |
| NVDA | Nvidia Corp. | 5.59% |
| TER | Teradyne Inc. | 3.61% |
| RCRUY | Recruit Holdings Co. Ltd. | 3.49% |
| 300124.SZ | Shenzhen Ignorance Technology Co. Ltd. | 3.23% |
| TSLA | Tesla Inc. | 2.99% |
| DE | Deere & Co. | 2.99% |
| N/A | Fidelity Securities Lending Cash Central Fund | 2.82% |
| ACN | Accenture PLC | 2.81% |
| ROK | Rockwell Automation Inc. | 2.71% |
| N/A | Net Other Assets | 2.66% |
| SIEGY | Siemens AG | 2.63% |
| ISRG | Intuitive Surgical Inc. | 2.58% |
| THKLY | TKH ADR | 2.44% |
1. Franklin Exponential Data ETF (XDAT)

The Franklin Exponential Data ETF (XDAT) seeks capital appreciation by investing in companies focused on or expected to tenet from the creation, collection, cleaning, analyzing, storage, securing, transport, selling candor use of data. The actively managed fund has $5.37 million in AUM, 41 holdings and an expense ratio of 0.50%.
Since its inception on Jan. 12, 2021, XDAT has lost gained 2.95% compared to the S&P 500’s gain of 55.89% over the same period.

Here are the current top 15 holdings in the Franklin Exponential Data ETF:
| Ticker | Holding’s Name | Shares | % of Net Assets | Market Value |
| MSFT | Microsoft Corp. | 950 | 7.84% | $421,163 |
| NOW | ServiceNow Inc. | 318 | 6.68% | $358,653 |
| FICO | Fair Isaac Corp. | 146 | 5.91% | $317,212 |
| PANW | Palo Alto Networks Inc. | 773 | 5.61% | $301,284 |
| DDOG | Datadog Inc. | 1,865 | 5.38% | $288,907 |
| CRWD | Crowdstrike Holdings Inc. | 785 | 5.07% | $272,218 |
| GOOGL | Alphabet Inc. | 1,349 | 4.65% | $249,794 |
| ANET | Arista Networks Inc. | 2,372 | 4.63% | $248,538 |
| META | Meta Platforms Inc. | 398 | 4.59% | $246,489 |
| EQIX | Equinix Inc. | 218 | 3.90% | $209,654 |
| MDB | Mongodb Inc. | 656 | 3.55% | $190,830 |
| TMUS | T-Mobile US Inc. | 770 | 3.35% | $179,795 |
| MNDY | Monday.com Ltd. | 505 | 2.60% | $139,597 |
| NET | Cloudflare Inc. | 1,191 | 2.47% | $132,439 |
| TTD | Trade Desk Inc. | 960 | 2.37% | $127,353 |
Contact [email protected] for any questions or corrections.