Five years ago today, a $10,000 investment in the SPDR S&P 500 ETF (NYSEARCA:SPY) would be worth $18,972—a 89.72% gain that underscores the rewards of broad-market investing. This performance comes without the need for stock-picking prowess or market-timing. SPY offers a low-cost way to ride the wave of America’s top companies, proving itself as a reliable and diversified position for every type of investor.
What is SPY?
At its core, SPDR S&P 500 ETF is one of the most popular exchange-traded funds (ETFs) in the world, launched in 1993 by State Street Global Advisors. It seeks to mirror the performance of the S&P 500 Index, a benchmark comprising 500 of the largest U.S. companies across diverse sectors like technology, healthcare, finance, and consumer goods. Unlike mutual funds, SPY trades like a stock on the NYSE Arca exchange, offering intraday liquidity and low trading costs. With an expense ratio of just 0.0945%, it’s incredibly cost-efficient—meaning more of your returns stay in your pocket. For beginners or seasoned investors alike, SPY provides instant diversification: owning a slice of America’s economic engine without the hassle of managing a portfolio stocks.
Top Holdings Driving Performance
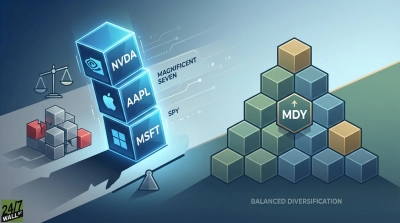
What fuels SPY’s growth? Its holdings reflect the titans driving the U.S. economy. As of early October 2025, the top 10 holdings account for about 38.78% of the fund’s assets, showcasing concentration in innovative leaders. NVIDIA Corporation (NASDAQ:NVDA | NVDA Price Prediction) tops the list at 7.96%, powering the AI revolution with its cutting-edge chips. Microsoft (NASDAQ:MSFT) follows at 6.73%, dominating cloud computing and software. Apple (NASDAQ:AAPL) holds 6.61%, thanks to its ecosystem of devices and services. Amazon (NASDAQ:AMZN) clocks in at 3.73%, leading e-commerce and logistics, while Alphabet (NASDAQ:GOOGL) and Meta Platforms (NASDAQ:META) round out key tech plays at around 2% each. Other notables include Broadcom (NASDAQ:AVGO) at 2.05% for semiconductors and Eli Lilly (NYSE:LLY) at 1.58% for pharmaceuticals. This mix isn’t static—holdings adjust quarterly to match the S&P 500—but it consistently captures growth sectors while balancing with stalwarts like Berkshire Hathaway and JPMorgan Chase.
Why SPY is a Good, Safe ETF for Investors
So, why is SPY such a safe bet? Diversification is key: spreading risk across 500 companies means no single stock can sink the ship. The S&P 500 has historically delivered average annual returns of about 10% over decades, outpacing inflation and most asset classes. Its massive size (over $500 billion in assets) ensures high liquidity, tight bid-ask spreads, and minimal tracking error. Regulated as a trust, SPY holds physical shares of underlying stocks, reducing counterparty risk compared to derivatives-based funds. For conservative investors, it’s a “set it and forget it” option: no need to chase trends or panic-sell during volatility. Studies show that time in the market beats timing the market, and SPY embodies that wisdom.
How the Past 5 Years Compare to History
The recent 89.72% five-year total return equates to an annualized gain of about 13.7%, handily beating the historical average five-year annualized return of 10.4% since 1926. This strong performance aligns with the post-pandemic recovery and tech-driven boom, but it’s not the hottest on record—the S&P 500’s best five-year stretch came during the late-1990s dot-com era (1995-1999), delivering a blistering 28.6% annualized.
On the flip side, tougher periods like the Great Depression (1928-1932) saw annualized losses of -12.5%, underscoring the market’s volatility. Over longer horizons, the S&P 500’s 150-year average annualized return stands at 9.4%, with dividends reinvested, proving that patience pays off even through downturns like the early 2000s (just 0.4% annualized from 2000-2004). SPY captures these cycles without the guesswork.
Of course, past performance isn’t a guarantee, and SPY isn’t immune to downturns—market corrections happen. But for those building retirement nests or steady portfolios, its blend of growth, stability, and simplicity is unmatched. If you’re sidelined, starting with SPY today could position you for the next five-year windfall.
Contact [email protected] for any questions or corrections.