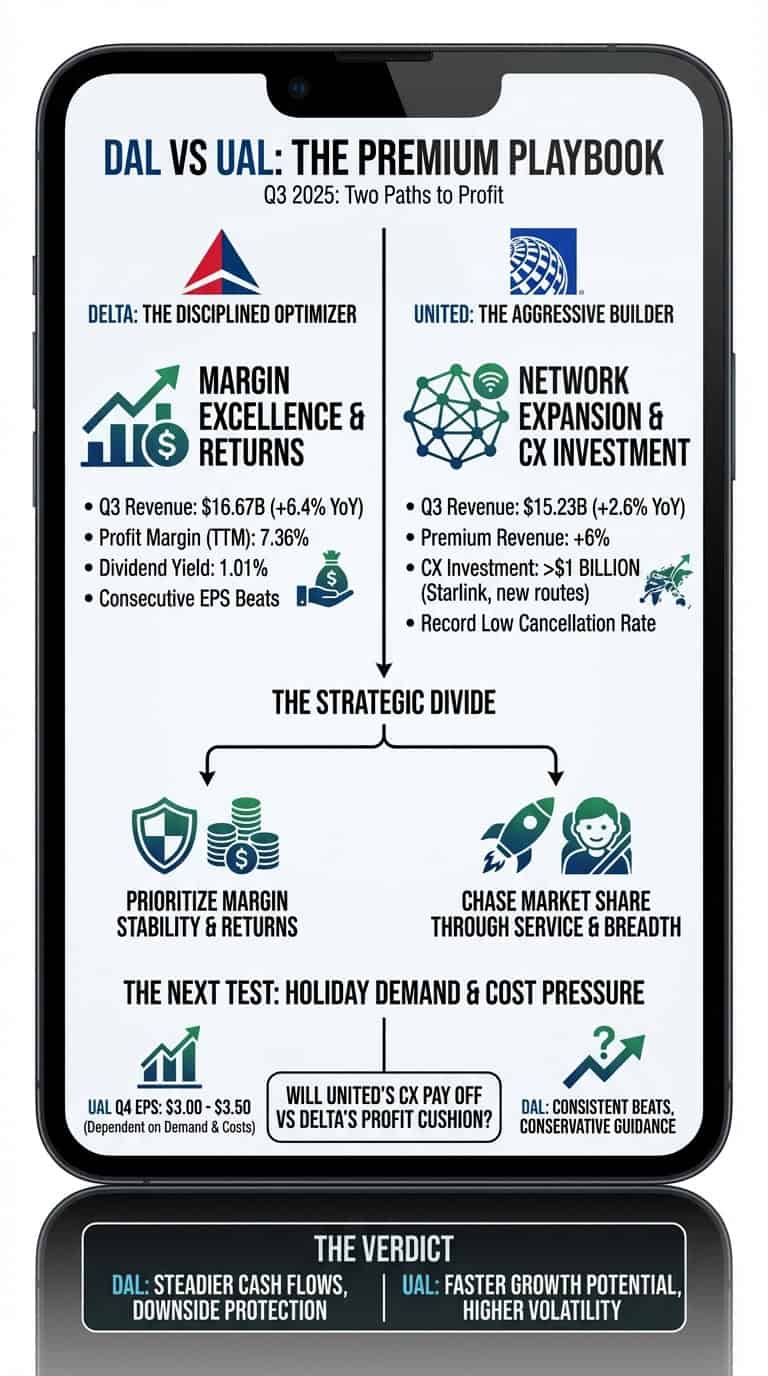
Delta Air Lines (NYSE: DAL | DAL Price Prediction) and United Airlines (Nasdaq: UAL) both reported Q3 2025 earnings that reveal how legacy carriers are navigating a market defined by premium cabin demand and operational discipline. Delta leaned into margin excellence and shareholder returns. United bet harder on network expansion and customer experience investments.
Premium Cabins Drive Both, But Execution Differs
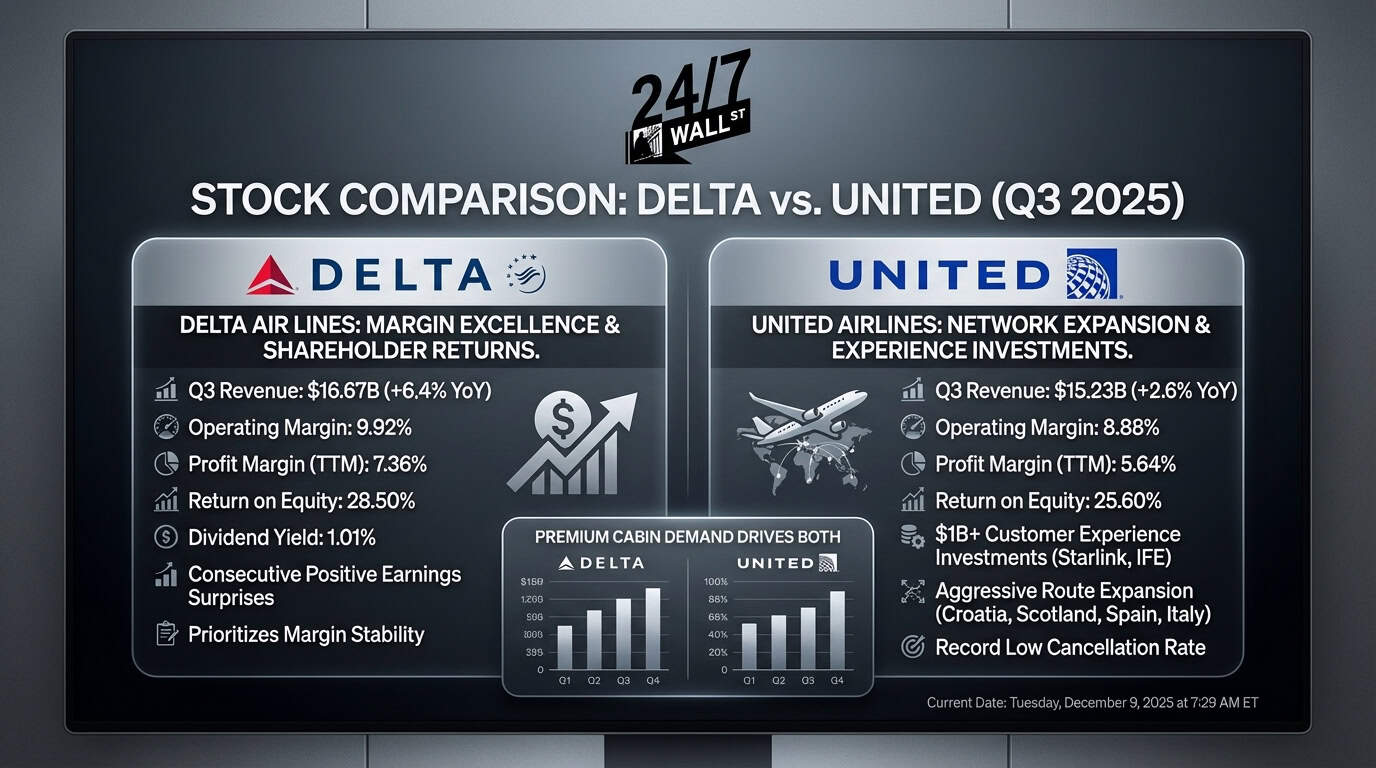
United reported Q3 revenue of $15.23 billion, missing estimates of $15.29 billion but growing 2.6% year over year. Premium cabin revenue jumped 6% while basic economy climbed 4%. Cargo rose 3% and the loyalty program expanded 9%. Net income of $949 million declined 1.7% from the prior year, and adjusted EPS of $2.78 beat estimates of $2.67 by 4.1%.
CEO Scott Kirby highlighted investments exceeding $1 billion in customer experience, including Starlink installations and enhanced inflight entertainment. United launched new routes to Croatia, Scotland, Spain, and Italy while posting a record low Q3 cancellation rate.
Delta generated Q3 revenue of $16.67 billion, up 6.4% year over year, with net income of $1.42 billion and operating margin of 9.92%. EPS of $1.71 beat estimates of $1.53 by 11.8%, marking the third consecutive quarter of positive surprises. Delta’s trailing twelve-month profit margin of 7.36% exceeded United’s 5.64% by 172 basis points.
| Metric | Delta (DAL) | United (UAL) |
| Q3 Revenue | $16.67B (+6.4% YoY) | $15.23B (+2.6% YoY) |
| Operating Margin | 9.92% | 8.88% |
| Profit Margin (TTM) | 7.36% | 5.64% |
| Return on Equity | 28.50% | 25.60% |
One Rewards Shareholders. One Reinvests Aggressively
Delta pays a dividend yielding 1.01% and maintains disciplined capital allocation. United pays no dividend and bought back just $19 million in shares during Q3, instead channeling capital into route expansion and technology upgrades. Delta prioritizes margin stability and shareholder returns, while United chases market share through service differentiation and network breadth.
United’s forward P/E of 7.09 trades below Delta’s 7.87, suggesting analysts expect faster earnings growth from United despite lower current margins. United’s price-to-sales ratio of 0.58 represents a 17% discount to Delta’s 0.698.
The Next Test Is Holiday Demand and Cost Pressure
United guided Q4 adjusted EPS between $3.00 and $3.50, depending on whether holiday travel demand holds and whether fuel and labor costs stay manageable. Delta has not yet provided detailed Q4 guidance in the available data, but its consistent earnings beats suggest conservative management expectations.
Whether United’s customer experience investments translate into sustained premium cabin growth and whether Delta can maintain its margin advantage as both carriers add capacity will determine relative performance. United’s aggressive reinvestment could pay off if brand loyalty strengthens, but Delta’s profitability cushion offers more downside protection.
Key Differences Between Delta and United
Delta offers a 9.92% operating margin, 1.01% dividend yield, and track record of beating estimates by an average of 8.5% over the past year, reflecting disciplined execution. United presents network expansion and service upgrades that analysts expect will drive faster earnings growth, with 18% upside to the $123.67 analyst target versus Delta’s 8% upside to $72.67. Delta provides steadier cash flows through higher margins and shareholder returns, while United’s strategy focuses on market share gains through customer experience investments, though with lower current margins and heavier reinvestment that increase volatility.
Contact [email protected] for any questions or corrections.