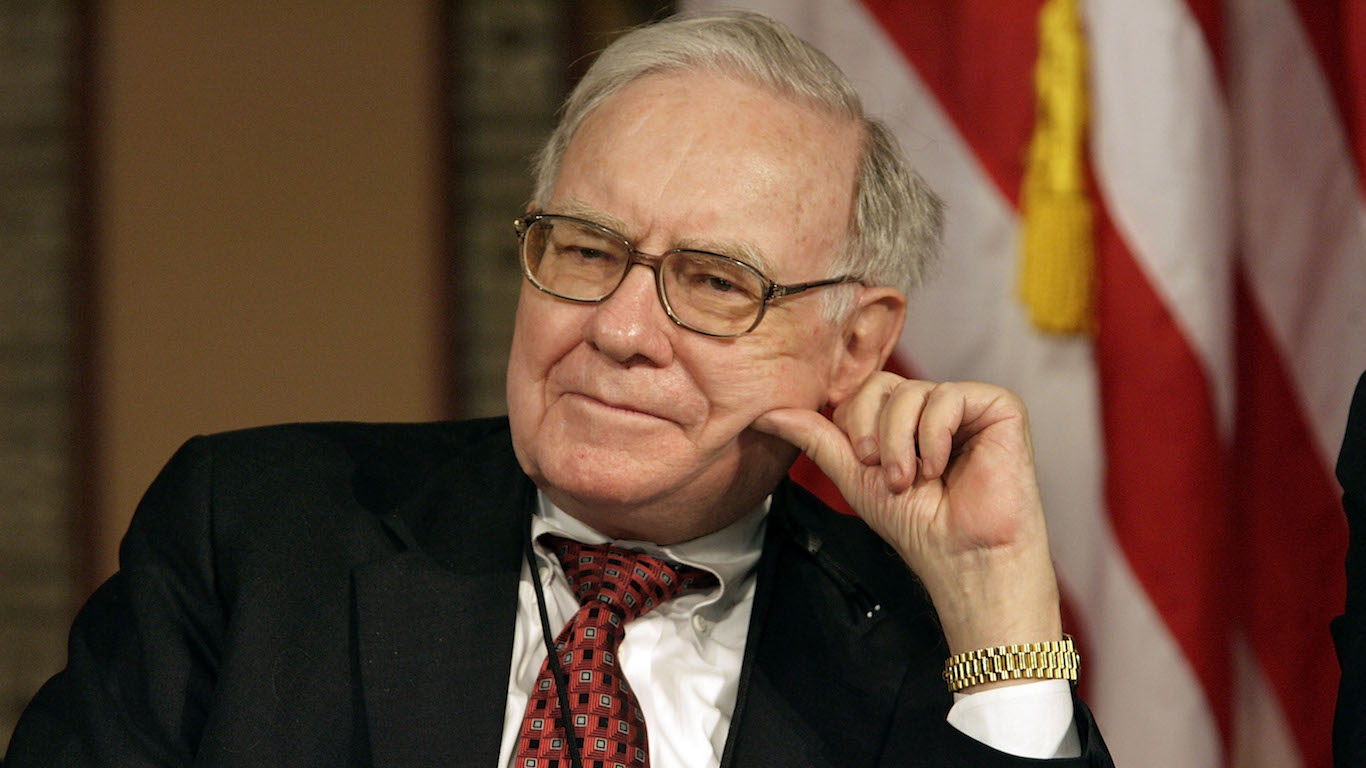
Warren Buffett’s remarkable success over six decades has turned Berkshire Hathaway (NYSE:BRK-A | BRK-A Price Prediction)(NYSE:BRK-B) into a phenomenon with something close to a cult following. Since assuming the helm of Berkshire in the mid-1960’s, the “Oracle of Omaha” has delivered better than 5 million percent returns, about 20% annually or twice those of the S&P 500 over the period.
Every year, thousands of investors travel to Omaha for the annual shareholder meeting, often called the “Woodstock for Capitalists,” to hear insights on investing and business. Following a long-planned leadership transition, Greg Abel officially assumed the role of CEO, while Buffett continues to guide the firm’s overarching strategy as Chairman.
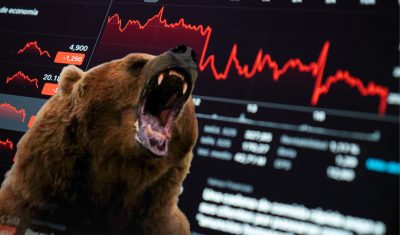
Yet, despite their adoration, investors appear to be ignoring the warning Berkshire has been signaling through its defensive financial positioning.
The Cash Pile Reaches a New Peak
While Berkshire leadership rarely issues explicit warnings about an impending market crash or advises against buying stocks, the conglomerate’s portfolio moves raise clear concerns.
Berkshire Hathaway extended its multi-year streak as a net seller of equities into early 2026, consistently unloading more shares than it purchased. This disciplined defense built the company’s cash reserves to a staggering record high of $397.4 billion. Rather than forcing capital into an expensive equity market, management has parked the vast majority of this capital in short-term U.S. Treasury bills, quietly generating billions in risk-free annual interest while waiting for better valuations.
Occasional purchases still occur when specific opportunities emerge, such as a stake in UnitedHealth Group or tech allocations, but major aggressive equity bets remain rare. Analysts interpret this historic cash buildup as clear evidence that management remains deeply uncomfortable with broader market valuations.
The Abel Era Breaks the Cash Fast
Despite holding an unprecedented amount of dry powder, Berkshire’s new leadership demonstrated it will still strike quickly when the right valuation appears. In a major move, CEO Greg Abel deployed $6.8 billion in an all-cash deal to acquire Taylor Morrison Home, one of the nation’s largest homebuilders.
While the acquisition marks a significant structural expansion for Berkshire’s housing portfolio, the multi-billion-dollar price tag represents a mere fraction of the company’s total cash reserves. The transaction underscores that while Berkshire is ready to act under new leadership, it remains overwhelmingly defensive and patient on a macro level.
A Classic Value Approach in Action
This strategy aligns with Berkshire’s core value investing philosophy of not overpaying for assets. By holding massive cash reserves, the company positions itself to deploy capital advantageously during downturns and buy numerous high-quality businesses at steep discounts.
Investors may question how to identify overvaluation today. While AI-driven gains have propelled equity valuations higher, echoing past tech booms, many market participants argue these companies are supported by genuine demand growth. However, Berkshire guidance has historically pointed to holistic market metrics to determine true value. In a classic 2001 article, Buffett famously noted that the ratio of total U.S. stock market capitalization to GDP is a vital gauge of where valuations stand at any given moment.
A Persistent Red Flag
Known as the Buffett Indicator, this metric divides total market cap—using the Wilshire 5000 as a proxy—by U.S. GDP. Readings above 100% indicate potential overvaluation, while levels above 200% historically signal extreme risk.
Current market data places the metric in historically dangerous territory. The Wilshire 5000 shows a total market capitalization of approximately $69.15 trillion, while annualized U.S. GDP sits around $31.57 trillion. This leaves the Buffett Indicator hovering near a massive 219%, sitting significantly above its historical trend line.
These figures indicate that asset prices have far outpaced actual economic output, raising the risk of a severe market correction if corporate growth or earnings fail to justify these premiums.
Key Takeaway
Every operational signal points to Berkshire viewing the broader market as highly overvalued. The persistent reliance on cash and short-term Treasuries underscores a deep patience for better entry points. Investors who completely dismiss Berkshire’s defensive posture do so at their own peril.
Editor’s Note: This article has been updated to reflect Berkshire Hathaway’s transition to its new executive leadership structure, alongside updated financial metrics including the company’s record Q1 cash balance, updated Buffett Indicator figures, and the recent acquisition of Taylor Morrison Home.
Contact [email protected] for any questions or corrections.