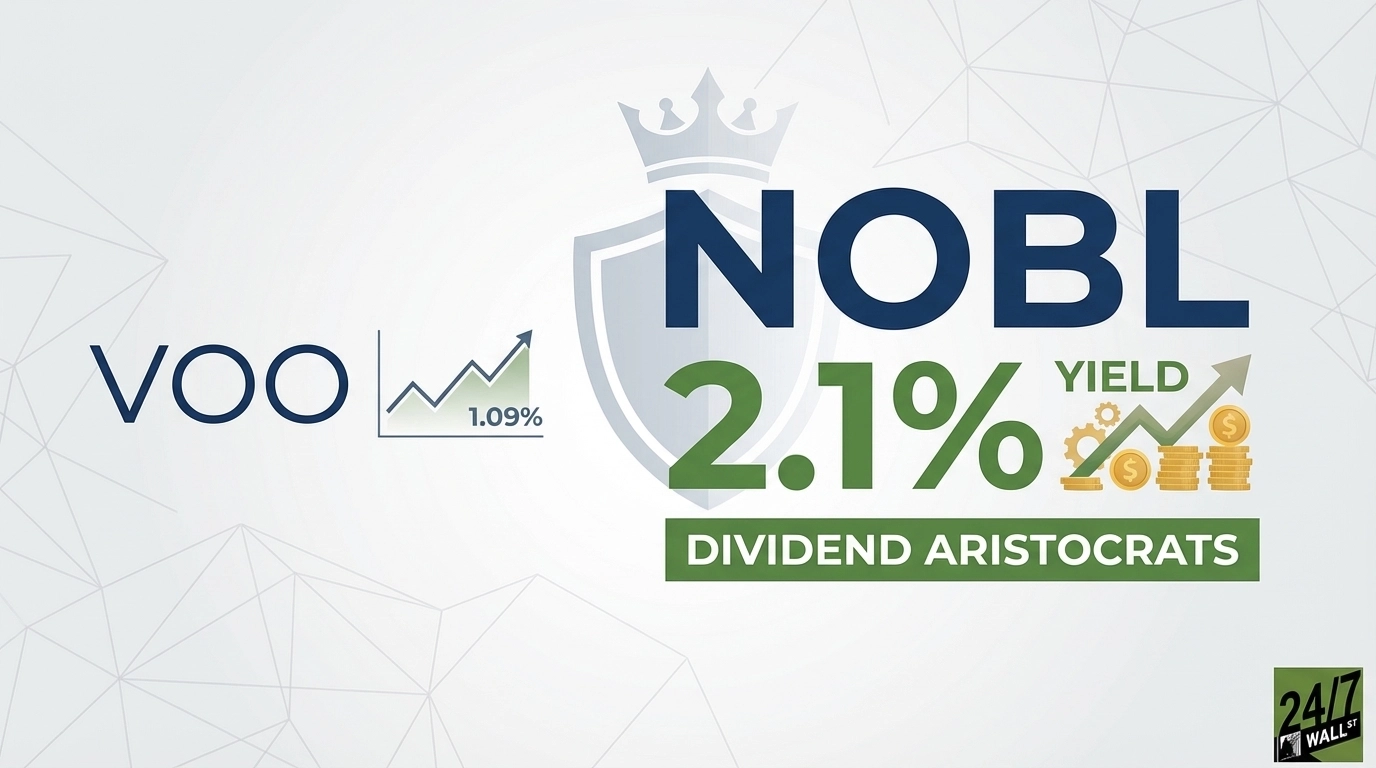
While Vanguard 500 Index Fund ETF Shares (NASDAQ:VOO) dominates the most popular ETF rankings with $1.5 trillion in assets and an industry leading 0.03% expense ratio, income investors should consider ProShares S&P 500Dividend Aristocrats ETF (NYSEARCA:NOBL) for superior cash flow. NOBL tracks 68 companies with 25+ consecutive years of dividend increases, yielding 2.1% versus VOO’s 1.09%—nearly double the income.
How NOBL Generates Income
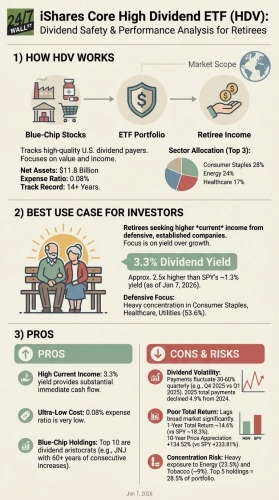
NOBL generates income exclusively from dividends paid by 68 blue-chip Dividend Aristocrats with proven records of raising dividends through multiple economic cycles. The ETF uses equal-weighting methodology, with holdings ranging from 1.2% to 2.1%, preventing over-concentration while maximizing exposure to consistent dividend payers across defensive sectors including Industrials (22.5%) and Consumer Staples (20.9%).
Dividend Safety Analysis: Top Holdings
The sustainability of NOBL’s dividend depends on its largest positions:
- Albemarle Corporation (2.06% weighting) presents the most risk with negative earnings of -$1.59 per share due to cyclical lithium pricing pressures. Despite this, the company maintains its $1.62 annual payout, exemplifying the Aristocrat commitment to maintaining dividends through temporary headwinds.
- Caterpillar (1.68% weighting) demonstrates aristocrat quality with 46.3% return on equity, 14.3% profit margin, and $5.84 annual dividend supported by $19.49 in earnings. CAT’s 30% payout ratio provides substantial safety margin, while $64.7 billion in revenue grew 9.5% year-over-year.
- Johnson & Johnson (1.51% weighting) offers 2.37% yield with 74% payout ratio—elevated but manageable given its 27.3% profit margin and diversified healthcare portfolio. With 60+ years of consecutive dividend increases, JNJ’s aristocrat pedigree is unmatched.
- Walmart (1.56% weighting) and Procter & Gamble (1.33% weighting) feature conservative payout ratios of 32% and 60% respectively. Both generate substantial free cash flow from recession-resistant businesses, supporting reliable dividend growth.
The VOO Comparison
VOO’s 1.09% yield reflects its tech-heavy composition, with 36% in Information Technology. While mega-caps like Nvidia (8.47%), Apple (6.88%), and Microsoft (6.60%) drive capital appreciation, many pay minimal or no dividends. VOO’s top 10 holdings represent 40% of the portfolio, creating concentration risk that NOBL’s equal-weighting avoids.
For retirees or income investors, NOBL’s 2.1% yield provides meaningful quarterly cash flow while defensive sector tilt reduces volatility. The trade-off is NOBL’s 0.35% expense ratio versus VOO’s 0.03%, costing an additional $320 annually per $100,000 invested.
Consider SCHD as an Alternative
Income investors should also evaluate Schwab U.S. Dividend Equity ETF (NASDAQ:SCHD), which offers 3.8% yield—the highest among quality dividend ETFs. SCHD tracks 100 high-dividend-yielding U.S. stocks screened for financial strength, with only 0.06% expense ratio. The fund emphasizes cash flow generation and dividend sustainability rather than consecutive increase streaks, resulting in higher current income. With $71.2 billion in assets and top holdings including Cisco (4.72%), Merck (4.63%), and AbbVie (4.23%), SCHD provides another path to reliable dividend income with superior yield versus both NOBL and VOO.
Contact [email protected] for any questions or corrections.