
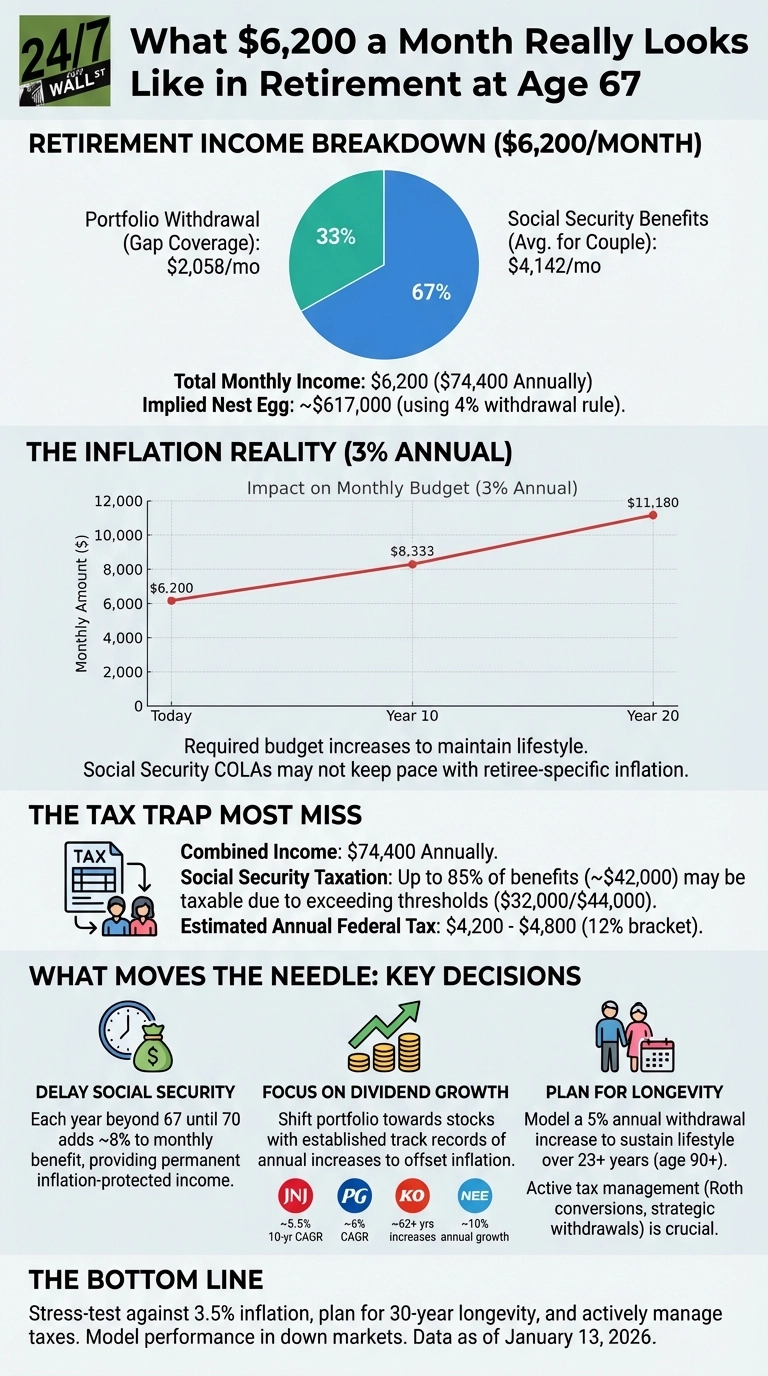
A retired couple living on $6,200 monthly ($74,400 annually) typically combines average Social Security benefits of around $2,081 each ($4,162 total) with portfolio withdrawals of roughly $2,038 to cover the gap. Under the traditional 4% withdrawal rule, that portfolio withdrawal points to a nest egg near $617,000. The real question is whether that income structure holds together over 20 or 30 years of inflation, market volatility, and rising healthcare costs.
The Inflation Math Nobody Wants to Run
Assume 3% annual inflation. That $6,200 monthly budget climbs to $8,333 in ten years and $11,180 in twenty years, just to maintain the same purchasing power. Social Security includes cost-of-living adjustments (the 2026 COLA was 2.8%), but those adjustments consistently trail retiree-specific inflation, particularly in healthcare. When Social Security grows at 2.5% annually while actual costs rise at 3.5%, the gap compounds year after year with no natural correction.
Portfolio withdrawals must grow faster than the 4% rule originally anticipated. A $617,000 portfolio generating modest returns could stretch 15 years under calm conditions, but sequence-of-returns risk can shorten that timeline dramatically. When markets fall hard in the early years of retirement, the retiree is forced to sell assets at depressed prices to meet living expenses. That reduces the number of shares remaining to participate in any recovery, permanently weakening the portfolio’s long-run capacity.
Social Security Taxation: The Threshold Trap
At $74,400 in combined income, this couple almost certainly pays federal tax on up to 85% of their Social Security benefits. The provisional income thresholds that trigger taxation sit at $32,000 (for any taxation) and $44,000 (for maximum taxation) for married couples filing jointly. Both thresholds have been frozen since 1984 and have never been indexed to inflation. With roughly $50,000 in Social Security and $25,000 in portfolio withdrawals, provisional income clears $44,000 easily, pushing about $42,000 of Social Security benefits into taxable territory.
One meaningful piece of new relief comes from the One Big, Beautiful Bill, signed into law in 2025. For tax years 2025 through 2028, taxpayers aged 65 and older can claim an additional $6,000 deduction per qualifying person, on top of the regular standard deduction. A couple where both spouses are 67 could claim up to $12,000 in extra deductions, subject to a phase-out above $150,000 in modified adjusted gross income. Combined with the $32,200 standard deduction for married couples filing jointly in 2026, total deductions for this couple could reach $44,200 or more, substantially shrinking taxable income. Even with that benefit, their estimated federal tax bill likely falls in the range of $2,500 to $3,500 annually, well below earlier projections that did not account for the new senior deduction. Strategic moves still matter: Roth conversions in early retirement years (before required minimum distributions begin), careful withdrawal sequencing to stay beneath taxation tiers, and qualified charitable distributions after age 70½ to satisfy RMDs without adding to adjusted gross income.
Building Income That Grows
Three strategies separate a retirement plan that survives volatility from one that quietly fails. The first is delaying Social Security past 67 whenever health and finances allow. Each year of delay through age 70 adds roughly 8% to the monthly benefit permanently, generating inflation-protected income that requires no portfolio drawdown to fund. Given that a 67-year-old couple has a 53% chance that at least one spouse reaches 90 or beyond, that permanent boost carries outsized value over a long retirement.
The second strategy is tilting the portfolio toward dividend growth rather than raw yield. Companies with multi-decade records of annual payout increases deliver rising income without forcing asset sales during downturns. Johnson & Johnson (NYSE:JNJ | JNJ Price Prediction) raised its quarterly dividend by 3.1% in April 2026 to $1.34 per share, marking its 64th consecutive year of increases, with an annual rate now at $5.36 per share and a current yield around 2.4%. Procter & Gamble (NYSE:PG) reached its 70th consecutive year of dividend increases in fiscal 2026 and currently yields close to 3%. Coca-Cola (NYSE:KO) has extended its streak to 64 consecutive years of increases and carries a yield near 2.7%. NextEra Energy (NYSE:NEE) has grown its dividend at double-digit annual rates for years and currently yields around 2.8%. These Dividend Kings and Dividend Aristocrats allow the income stream to rise organically, helping offset inflation over time without forcing principal sales when markets fall.
The third strategy is planning for longevity beyond the averages. A couple both aged 67 faces real odds that one spouse will need income for 25 or 30 more years. That timeline amplifies inflation’s effect, multiplies healthcare costs, and can eventually trigger long-term care expenses that dwarf other budget lines. Building a 5% annual spending increase into retirement projections reveals whether the portfolio can truly sustain the lifestyle, rather than assuming static expenses and hoping for favorable conditions.
Making the Numbers Work
This $6,200 monthly scenario remains viable only when stress-tested against realistic conditions: 3.5% inflation or higher in healthcare categories, a 30-year joint life expectancy, and active tax management. Morningstar’s 2025 State of Retirement Income report sets the safe starting withdrawal rate at 3.9% for new retirees targeting inflation-adjusted spending over a 30-year horizon, slightly below the traditional 4% benchmark, reflecting current market valuations and the forward-looking bond yield environment.
The most common planning mistake is treating today’s comfort as a proxy for tomorrow’s security. A sound plan models portfolio performance during bear markets, not just long-run average returns. Consider whether two or three years of part-time work at the start of retirement could postpone portfolio withdrawals long enough to let compounding work in the background. Run the numbers with the assumption that Social Security COLAs consistently trail actual spending growth. Those conservative inputs transform a plan that merely works today into one built to absorb volatility, inflation spikes, and the longevity that modern healthcare makes increasingly common.
Editor’s note: This update refreshes the average Social Security benefit figure to the April 2026 level of $2,081 per month, updates Johnson & Johnson’s dividend streak to 64 consecutive years following its April 2026 increase and Procter & Gamble’s streak to 70 years, and adds context on the new $6,000-per-person senior deduction created by the One Big, Beautiful Bill for tax years 2025 through 2028, which meaningfully reduces the federal tax estimate for retirees in this income range.
Contact [email protected] for any questions or corrections.