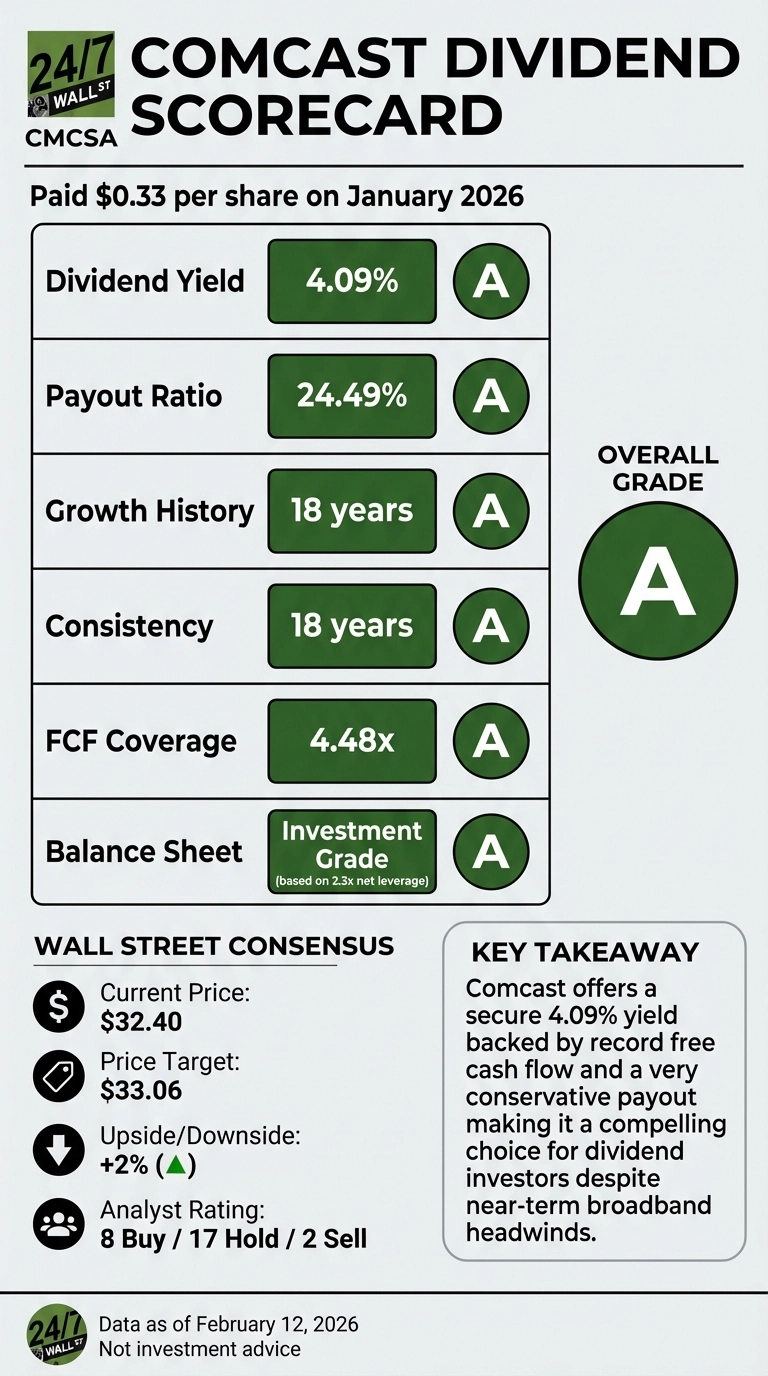
Comcast recently sent $0.33 per share to investors in January 2026, marking the company’s eighteenth consecutive year of dividend growth. The cable and media giant’s dividend program stands out in a sector where many competitors have slashed or eliminated payouts entirely.
With a current yield of 4.09% and a remarkably conservative payout ratio of just 24.49%, Comcast’s dividend looks sustainable even as the company navigates intense broadband competition and invests heavily in growth initiatives. But the real story lies in the cash flow generation backing these payments.
Record Free Cash Flow Provides Dividend Cushion
Comcast generated $21.9 billion in free cash flow during 2025, the highest annual figure in company history. That translates to 4.48x coverage for the $4.9 billion paid out in dividends-well above the 2.0x threshold typically considered safe.
The improvement from 2024 is striking. Free cash flow jumped 41.3% year-over-year, driven by stronger operating cash flow and reduced capital expenditures. Even after funding $7.2 billion in share repurchases, the company returned only 55% of its free cash flow to shareholders, leaving substantial cushion for economic downturns or strategic investments.
CFO Jason Armstrong emphasized the company’s financial flexibility during the Q4 2025 earnings call: “Our capital allocation strategy remains unchanged. Our priorities are to invest organically in our growth businesses, maintain a strong balance sheet, and return capital to shareholders.”
Dividend Growth Trajectory Slows but Remains Intact
Comcast has increased its quarterly dividend from $0.1575 in 2017 to $0.33 in 2026, representing a 109% increase over nine years or roughly 8.5% compounded annually. The most recent increase came in Q2 2025, when the company raised the quarterly payment from $0.31 to $0.33—a 6.5% bump.
While the growth rate has moderated from the 8-9% annual increases seen in 2021-2022, management confirmed investors should expect another increase in 2026. Armstrong stated: “Our investors should see higher total dividends in 2026, marking our eighteenth consecutive year of dividend growth.”
The company maintains a quarterly payment schedule with ex-dividend dates typically falling in early January, April, July, and October. The next payment is scheduled for April 22, 2026 for shareholders of record as of April 1, 2026.
How Comcast Stacks Up Against Telecom Peers
Comcast’s dividend profile stands in sharp contrast to major competitors in the cable and telecom space:
| Company | Dividend Yield | Payout Ratio | Recent Dividend Action |
|---|---|---|---|
| Comcast (CMCSA) | 4.09% | 24.49% | 18 consecutive years of growth |
| AT&T (T) | 4.05% | 35.1% | Flat since 2023 (cut 47% in 2022) |
| Charter (CHTR) | 0% | N/A | No dividend program |
Charter Communications, Comcast’s primary cable competitor, pays no dividend at all, choosing instead to focus capital allocation entirely on debt reduction and share buybacks. AT&T offers a similar yield to Comcast but with a higher payout ratio and a troubling recent history—the telecom giant slashed its dividend by 46.6% in 2022 and has kept it frozen at $1.11 annually since then.
Near-Term Headwinds Could Test Dividend Policy
While Comcast’s dividend appears secure, several factors warrant monitoring. The company benefited from approximately $2 billion in one-time tax benefits during 2025 that will not repeat in 2026. Armstrong explicitly warned that 2026 cash tax benefits would be “significantly lower” than 2025’s outsized gains.
The company is also entering what management calls its “largest broadband investment year in our history” as it completes network upgrades and transitions customers to simplified pricing. This investment cycle is pressuring near-term EBITDA, which declined 10.3% in Q4 2025.
The broadband business lost 181,000 subscribers in Q4 2025 as fiber and fixed wireless competition intensified. Armstrong acknowledged that “incremental EBITDA pressure over the next couple of quarters” is expected until the company laps these initial investments.
Growth Engines Offset Legacy Business Pressure
Comcast’s dividend sustainability ultimately depends on whether growth businesses can offset broadband headwinds. Three segments showed particularly strong momentum in Q4 2025:
Domestic Wireless: Revenue jumped 18% as the company added 1.5 million net lines during 2025, reaching 9 million total lines. Current penetration of just 15% of the residential broadband base suggests significant runway for continued growth.
Peacock Streaming: Revenue grew 23% to $1.6 billion in Q4, while losses improved by $700 million year-over-year for the full year. Management expects “Peacock losses to meaningfully improve again” in 2026 as NBA content drives subscriber growth.
Theme Parks: Revenue surged 21.9% to $2.89 billion, with EBITDA crossing $1 billion for the first time in a single quarter. The opening of Epic Universe and continued international expansion should support momentum.
Balance Sheet Supports Dividend Through Cycles
Comcast ended 2025 with net leverage of 2.3x, comfortably within investment-grade territory. Co-CEO Michael Cavanagh emphasized the company’s financial positioning: “We have the financial strength to perform through cycles and create long-term value.”
The recent spinoff of cable networks into Versant Media will temporarily increase leverage ratios, but management stated its “intention will be to migrate back to the 2025 ending leverage of 2.3 times.” Importantly, the Versant transaction was structured as a dividend distribution to shareholders, maintaining Comcast’s dividend growth streak while removing lower-growth assets from the portfolio.
Valuation Suggests Limited Downside Risk
At a trailing P/E ratio of just 6x and trading 20% below its five-year high, Comcast shares appear to price in significant pessimism about the broadband business. The current $32.40 stock price sits just below the $33.06 average analyst target, suggesting limited downside from current levels.
The combination of a 4% yield, conservative payout ratio, and depressed valuation creates an asymmetric risk profile for dividend-focused investors. Even if growth initiatives disappoint, the substantial free cash flow cushion and strong balance sheet should allow Comcast to maintain or potentially grow its dividend through 2026 and beyond.