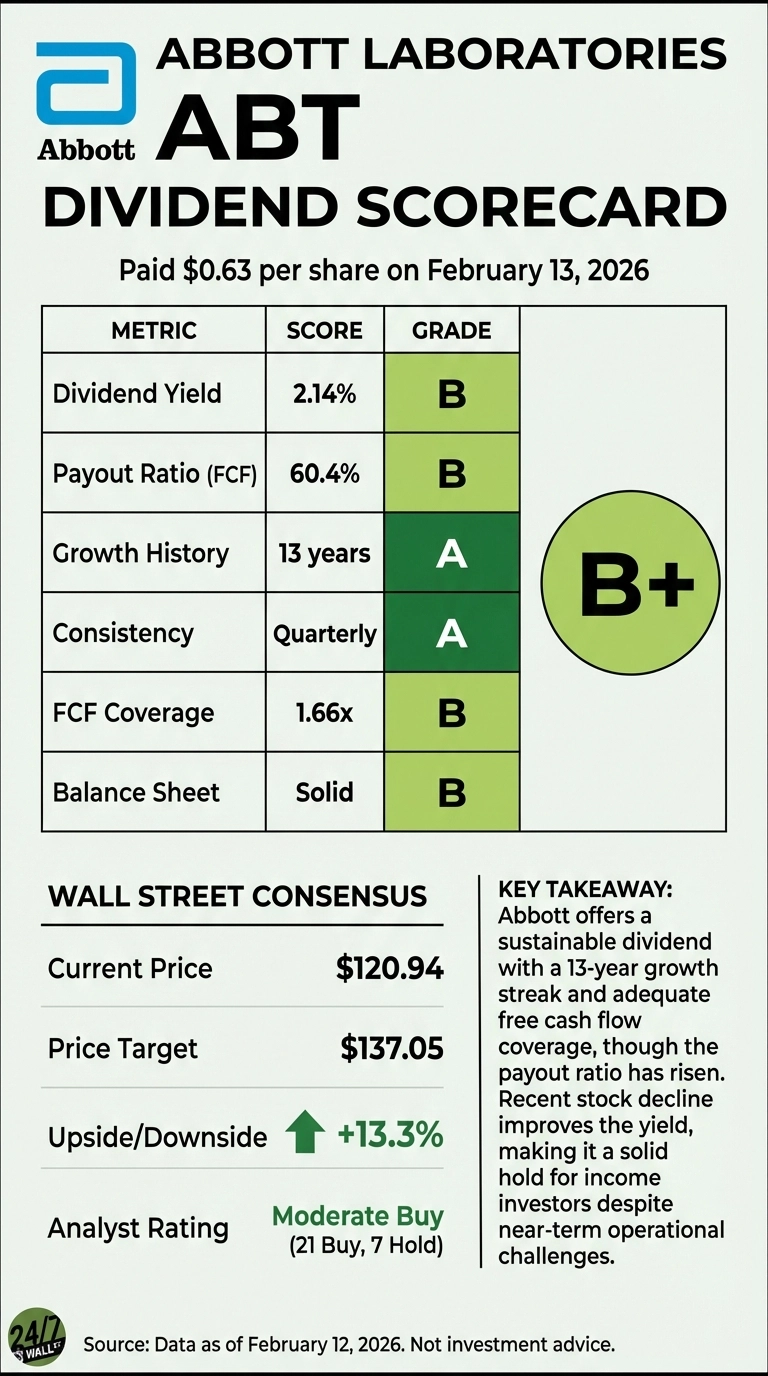
Abbott Laboratories just paid its quarterly dividend of $0.63 per share on February 13, 2026, marking a 6.8% increase from the prior quarterly rate. For income investors evaluating this healthcare giant’s dividend sustainability, the payment arrives amid a complex backdrop: strong operational execution in medical devices offset by product recalls and nutrition segment weakness. With shares down 9.8% year-to-date, the 2.14% yield looks increasingly attractive, but does the dividend quality justify the investment?
Dividend Growth Streak Remains Intact
Abbott’s dividend track record demonstrates consistency. The company has increased its dividend for 13 consecutive years, with the annual payout growing from $1.04 in 2016 to $2.36 in 2025 – a 127% total increase representing a 9.2% compound annual growth rate over the decade. The most recent quarterly increase from $0.59 to $0.63 continues this pattern, though the growth rate has moderated from the double-digit pace seen earlier in the decade.
Management’s commitment remains explicit. CEO Robert Ford stated during the recent earnings call: “We are committed to a growing dividend, and we did that again for 2026 when we announced our dividend back in December.” This commitment comes despite mixed Q4 results that saw revenue of $11.46 billion miss expectations while adjusted EPS of $1.50 met estimates.
Cash Flow Coverage Shows Adequate Cushion
The dividend’s sustainability depends on cash generation, and Abbott’s metrics provide reasonable comfort. In fiscal 2024, the company generated $8.56 billion in operating cash flow and $6.35 billion in free cash flow after $2.21 billion in capital expenditures. Against this, Abbott paid $3.84 billion in dividends, resulting in a 60.4% free cash flow payout ratio.
This represents a notable increase from the 42.4% payout ratio in 2022, when free cash flow reached $7.80 billion. The trend reflects both growing dividend commitments and moderating cash generation as COVID-related testing revenue declined. Still, the current payout ratio remains within sustainable bounds, leaving room for continued dividend growth even if free cash flow remains flat.
Quarterly patterns show some volatility. In Q1 2025, the free cash flow payout ratio reached 110%, with dividends exceeding quarterly free cash flow. However, this normalized in subsequent quarters, with Q3 2025 showing a 45% payout ratio. The annual view provides a more accurate assessment of sustainability than individual quarters.
Profitability Supports Dividend but Faces Headwinds
Abbott’s profitability metrics demonstrate the earnings power behind the dividend. The company maintains a 22% operating margin and 14.7% profit margin, with return on equity of 13.2%. These figures support dividend sustainability, though they’ve come under pressure from operational challenges.
The most significant concern stems from the FreeStyle Libre glucose sensor recall. The FDA classified this as a Class I recall – the most serious category – after 860 serious injuries and 7 deaths were linked to incorrect glucose readings. This affects Abbott’s high-margin diagnostics segment and carries potential litigation and regulatory costs that could pressure future profitability.
Offsetting this, Abbott’s medical devices segment showed strength with 12.3% growth in Q4. The company’s electrophysiology products, particularly the Volt Pulsed Field Ablation system, delivered strong clinical results with 84.2% freedom from rhythm recurrence in paroxysmal atrial fibrillation at 12 months. These innovations provide growth drivers that support future dividend increases.
Forward Guidance Suggests Modest Growth Ahead
Management’s 2026 outlook provides context for dividend sustainability. Abbott guided to $5.55-$5.80 adjusted EPS, representing approximately 10% growth at the midpoint. The company expects 6.5-7.5% organic sales growth, with continued margin expansion of 50-70 basis points annually.
This guidance incorporates known headwinds. The nutrition segment, which declined 8.9% in Q4, faces continued pressure in the first half of 2026 before an expected recovery. CFO Philip Boudreau noted the company’s balance sheet remains “in great shape” with post-acquisition leverage of approximately 2.7x debt-to-EBITDA following the Exact Sciences acquisition.
The Exact Sciences deal adds a $3 billion business growing at 15% in the cancer diagnostics space, diversifying Abbott’s revenue base. While this carries near-term integration costs and expected 20-cent EPS dilution, it positions the company for long-term growth that supports future dividend increases.
Valuation and Peer Comparison
Abbott’s trailing P/E ratio of 30x appears elevated, though the forward P/E of 20x suggests normalization as earnings grow. Compared to peer Johnson & Johnson’s 2.16% dividend yield and 46.6% payout ratio, Abbott’s 63.8% payout ratio shows less cushion but remains sustainable.
The stock’s 12.2% decline over the past year contrasts with its dividend growth, creating a higher yield entry point. Institutional investors maintain 81.7% ownership, suggesting confidence in the long-term story despite near-term challenges.
The Verdict: Solid Dividend with Manageable Risks
Abbott’s dividend earns a solid grade based on its 13-year growth streak, adequate free cash flow coverage, and management’s explicit commitment to increases. The 60.4% free cash flow payout ratio provides sufficient cushion for continued growth, while diversified revenue streams across medical devices, diagnostics, nutrition, and pharmaceuticals reduce concentration risk.
However, investors should monitor several factors. The FreeStyle Libre recall represents a material risk to profitability and reputation. The nutrition segment’s recovery timeline remains uncertain, with management expecting challenges through mid-2026. The elevated payout ratio compared to historical levels leaves less room for error if cash generation disappoints.
For income investors seeking healthcare exposure, Abbott’s dividend appears sustainable at current levels with modest growth potential. The 2.14% yield won’t excite high-yield seekers, but the combination of dividend growth, operational diversification, and innovation pipeline provides a reasonable total return profile. The recent price decline has improved the risk-reward equation, though the dividend alone doesn’t compensate for potential capital losses if operational challenges intensify.
Contact [email protected] for any questions or corrections.