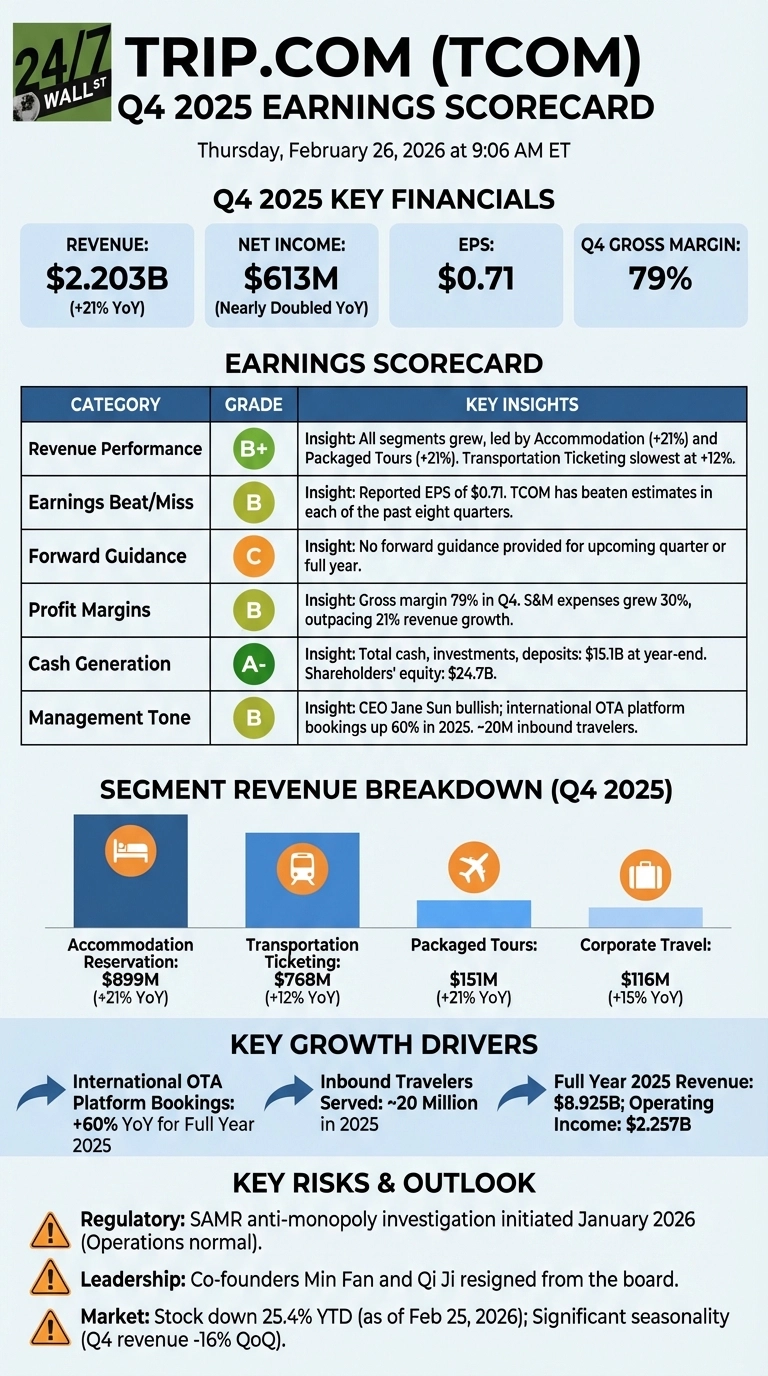
Trip.com Group (NASDAQ: TCOM) closed out 2025 on a strong note, reporting Q4 revenue of $2.203 billion, up 21% year-over-year, with net income that nearly doubled compared to the prior year period. The headline numbers reflect a company still firing on most cylinders internationally, even as elevated marketing spend and a new regulatory investigation introduce fresh uncertainty. TCOM shares closed at $53.66 on February 25, down 25.4% year-to-date, meaning the stock enters this report already under meaningful pressure.
Q4 2025 Earnings Scorecard
| Category | Grade | Key Insight |
|---|---|---|
| Revenue Performance | B+ | All four segments grew, led by Accommodation (+21%) and Packaged Tours (+21%), with Transportation Ticketing the slowest at +12%; no analyst revenue estimate was available for direct comparison. |
| Earnings Beat/Miss | B | Reported EPS of 71 cents with no published consensus estimate available; TCOM has beaten Wall Street expectations in each of the past eight quarters, providing favorable context even without a direct Q4 comparison. |
| Forward Guidance | C | No forward guidance was provided for the upcoming quarter or full year, leaving investors without a management-set benchmark heading into 2026. |
| Profit Margins | B | Gross margin held at 79% in Q4, with full-year gross margin reaching 80.6%; however, sales and marketing expenses grew 30% in Q4, outpacing revenue growth of 21%, compressing operating leverage. |
| Cash Generation | A- | Total cash, investments, and deposits stood at $15.1 billion at year-end, against a market cap of roughly $34.6 billion; the balance sheet carries significant liquidity with shareholders’ equity of $24.7 billion. |
| Management Tone | B | CEO Jane Sun struck a confident tone, citing international OTA platform bookings up 60% for full year 2025 and roughly 20 million inbound travelers served, though the absence of guidance and two co-founder board departures temper the optimism. |
Bottom Line
Trip.com’s Q4 results confirm the company’s international expansion is gaining real traction, with its global platform growing at three times the rate of its domestic business. The full-year story is compelling: revenue of $8.925 billion and operating income of $2.257 billion reflect a scaled, profitable travel platform.
The concerns are real but not yet structural. Marketing spend growing faster than revenue is a deliberate investment in market share, not a sign of deteriorating unit economics. More pressing is the SAMR anti-monopoly investigation initiated in January 2026, which introduces regulatory uncertainty that is difficult to price. The resignations of co-founders Min Fan and Qi Ji from the board add to the overhang.
Investors should watch whether Q1 2026 marketing spend begins to moderate relative to revenue growth, and for any update on the SAMR investigation’s scope. The stock’s 25% year-to-date decline already reflects some of this uncertainty; how management addresses regulatory risk in coming quarters will likely determine whether that discount narrows or widens.