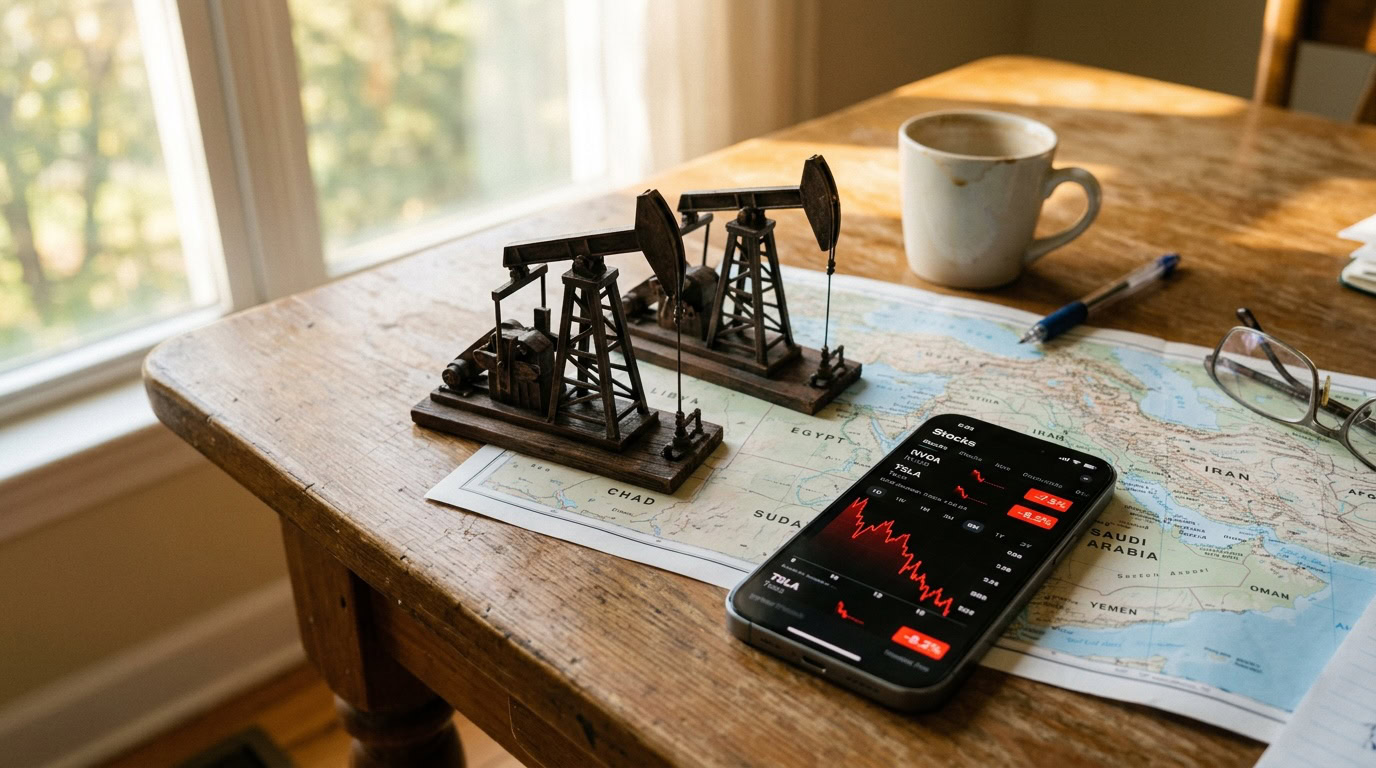
WTI crude oil futures are trading near $120 per barrel tonight, and the energy market is staring down a historic moment. Just three weeks ago, oil was sitting at $66 per barrel on February 20. Tonight, futures markets exploded by 30%, a historic move.
The bigger picture?
The all-time record for a barrel of oil is $147.27; that record was set all the way back in July 2008.
Put another way, we’re now staring down a potentially historic moment.
That has broad ramifications. If you own energy stocks, they’re likely going to rally tomorrow. Exxon Mobil (NYSE: XOM) is already up 23% year-to-date. Chevron (NYSE: CVX) is up 22%. More niche ideas like the Breakwave Tanker Shipping ETF (NYSE: BTWT) are up astounding amounts like 207% so far in 2026.
If you own anything else, it’s likely going to sell off extremely hard when the marekt owns tomorrow. Dow Jones futures are down 2.2% as of 11 p.m. ET on March 8th.
Let’s look at the history of oil price spikes and where we stand today. It might surprise you how close oil prices have suddenly gotten relative to historic levels.
Notable WTI Price Spikes in Modern History
| Date | WTI Peak Price | Primary Driver |
|---|---|---|
| July 2008 | $147.27/barrel | Emerging market demand surge, supply constraints |
| June 2022 | $123.64/barrel | Russia’s invasion of Ukraine |
| March 8, 2026 | $120/barrel (futures) | Iran War, Strait of Hormuz threat |
The Strait of Hormuz Is the Pressure Point
The US is now engaged militarily with Iran, and Tehran is threatening to close the Strait of Hormuz. Countries at risk include Saudi Arabia at 10.8 million barrels per day, the UAE and Iraq each at 4.5 million, Kuwait at 2.8 million, Qatar at 1.8 million, and Iran itself at 4.6 million barrels per day. A closure would remove an enormous share of global supply overnight.
The US is the world’s largest oil producer, pumping approximately 22.8 million barrels per day compared to just 5 million barrels per day in 2008. But even that dominance cannot fully insulate global markets from a Hormuz disruption.
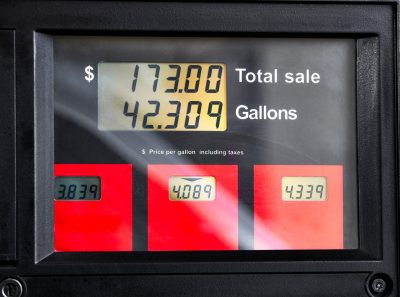
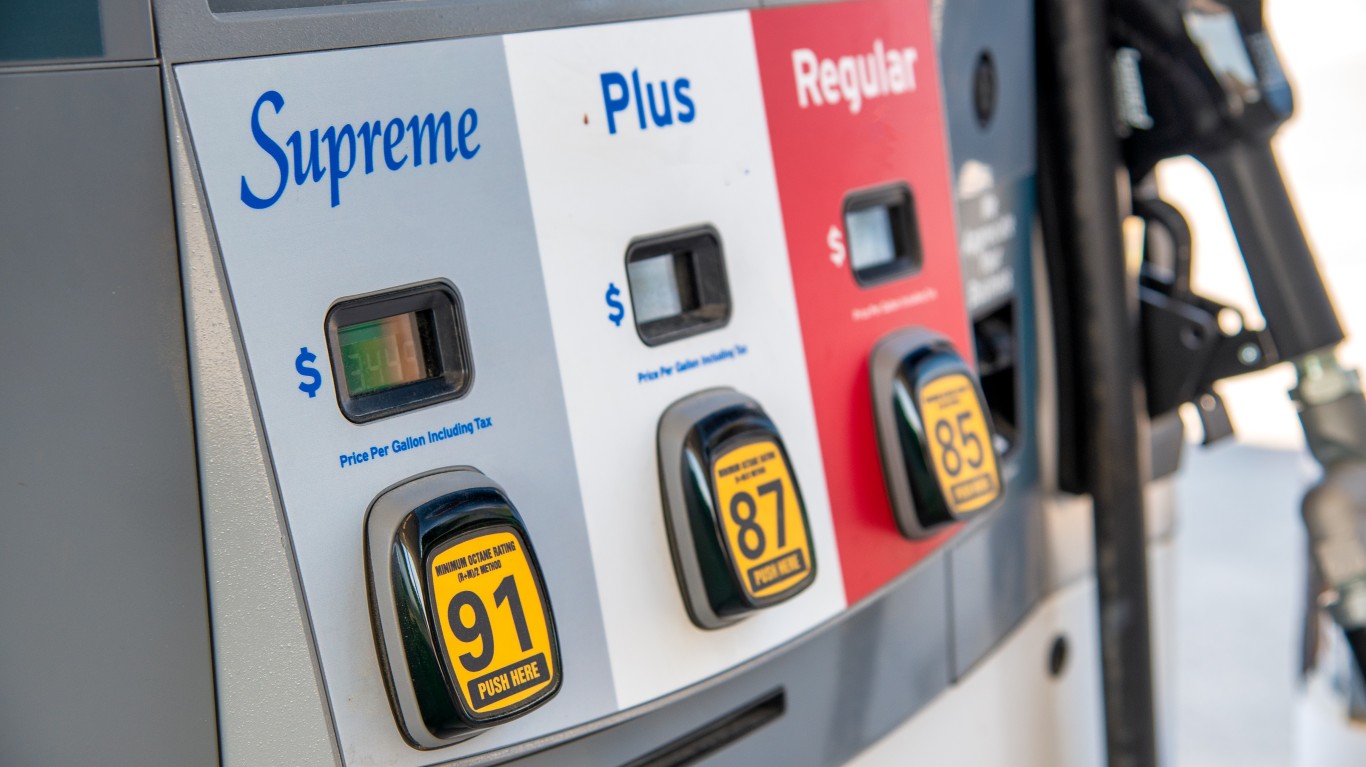
What This Means at the Pump
The national average gas price is already $3.45 per gallon as of March 8, 2026, according to AAA. The AAA all-time record stands at $5.02 per gallon, set June 14, 2022. If oil breaks $147.27, pump prices would almost certainly shatter that record too. Track what’s coming in our companion pieces on national gas prices exploding higher and California potentially crossing $7 per gallon.
With $120 oil tonight and the record at $147.27, this week’s developments in the Iran conflict could push energy markets into uncharted territory. Follow the moves in our live oil futures tracker.
Polymarket Futures place 36% odds on nationwide gas prices crossing $5 by the end of the month. That would nearly tie June’s record. We’ll see if prediction markets move tomorrow now that oil price futures are jumping to historic levels.