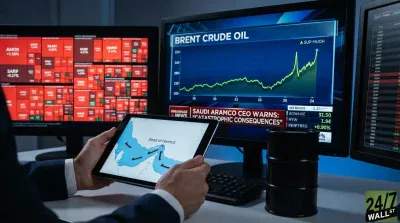
WTI crude soared well over $115 per barrel on Sunday, its highest level since 2022, after Gulf producers including Saudi Arabia, Kuwait, Iraq, and the UAE slashed output amid near-closure of the Strait of Hormuz. The S&P 500 (SPY) is down over the past the week, while energy names are outperforming. History offers a clear pattern, but also a warning.
The Historical Playbook
| Episode | Oil Spike | S&P 500 Short-Term | 12-Month Outcome | Recession? | Big Winner |
|---|---|---|---|---|---|
| 1973–74 Embargo | +300% (~$12) | –48% | Deep bear, years to recover | Yes (stagflation) | Energy |
| 1979 Iran Revolution | +165% (~$40) | Volatile | Mixed before recession | Yes | Energy |
| 1990 Gulf War | +135% (~$46) | –16% to –18% | +26–29% rebound | Mild & short | Energy + Defense |
| 2008 Peak | +145% ($147) | –57% | Severe bear | Yes (severe) | None |
| 2022 Ukraine | +60–70% ($120+) | –7–10% initial | Correction then recovery | No | Energy |
The Closest Analog: 1990 Gulf War
The episode Wall Street is referencing most is 1990. Oil surged roughly 135% to around $46 per barrel, the S&P 500 fell 16–18%, and then rebounded 26–29% in 1991 once the conflict ended and crude collapsed. The recession was mild and short-lived. Markets recovered quickly once the geopolitical trigger was removed. That’s the bull case today, a supply shock that resolves, not a structural economic break.
Key Risks to Watch
- Demand destruction: At $100 +oil, consumer spending contracts. Pessimistic sentiment readings and rising CPI already point in this direction.
- Fed paralysis: If inflation spikes while growth slows, the Fed has no clean move — the worst outcome for broad equity markets.
- Production response: U.S. shale and OPEC spare capacity could cap the rally faster than geopolitical headlines suggest.
What’s Happening Right Now
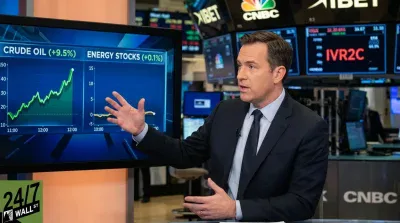
The market reaction today reflects that uncertainty. The VIX has surged to 31 this past week, moving over the high-fear threshold of 30. SPY is down 2.46% over the past week and off 1.82% year-to-date. Energy is the clear outlier: ExxonMobil (NYSE: XOM | XOM Price Prediction) is up 23% year-to-date and Chevron (NYSE: CVX) has gained 21% since January 1. The divergence between energy and the broad market is the defining trade of this oil shock.
The earnings foundation supports that divergence. ExxonMobil delivered record full-year production of 4.7 million oil-equivalent barrels per day in 2025, its highest in over 40 years, while beating Q4 EPS estimates at $1.71 versus the $1.66 consensus. That production was achieved when Brent averaged just $64 per barrel in Q4 2025. At $119 crude, the earnings leverage is substantial. Chevron similarly beat Q4 EPS at $1.52 against a $1.44 estimate and generated record operating cash flow of $33.90 billion for full-year 2025 despite declining oil prices.
Best Case vs. Worst Case
Best case (1990/2022 style): A diplomatic breakthrough or G-7 strategic reserve release pushes oil back below $100. Stocks rebound sharply within weeks, and energy names hold most of their gains. Historical precedent favors this outcome when the supply shock is geopolitical rather than demand-driven.
Worst case (1970s style): Oil stays above $100 for months, inflation re-accelerates, and the Fed stays on hold. Consumer sentiment is already at 56.4 — well into pessimistic territory — which compounds the risk. CPI has been rising steadily, reaching 326.6 in January 2026, leaving limited cushion before stagflation concerns become consensus.
What It Means for Your Portfolio
Energy and defense have been the consistent hedge in every oil shock episode in the table above. XOM’s $20 billion share repurchase plan through 2026 and 43 consecutive years of dividend growth provide a return floor that pure commodity plays lack. CVX’s $27.1 billion returned to shareholders in 2025 signals the same discipline. Watch for oil holding above $100, any Strait of Hormuz diplomatic developments, and the 10-year Treasury yield, currently at 4.13%, for the next signal on whether this is a 1990 or a 1970s replay.