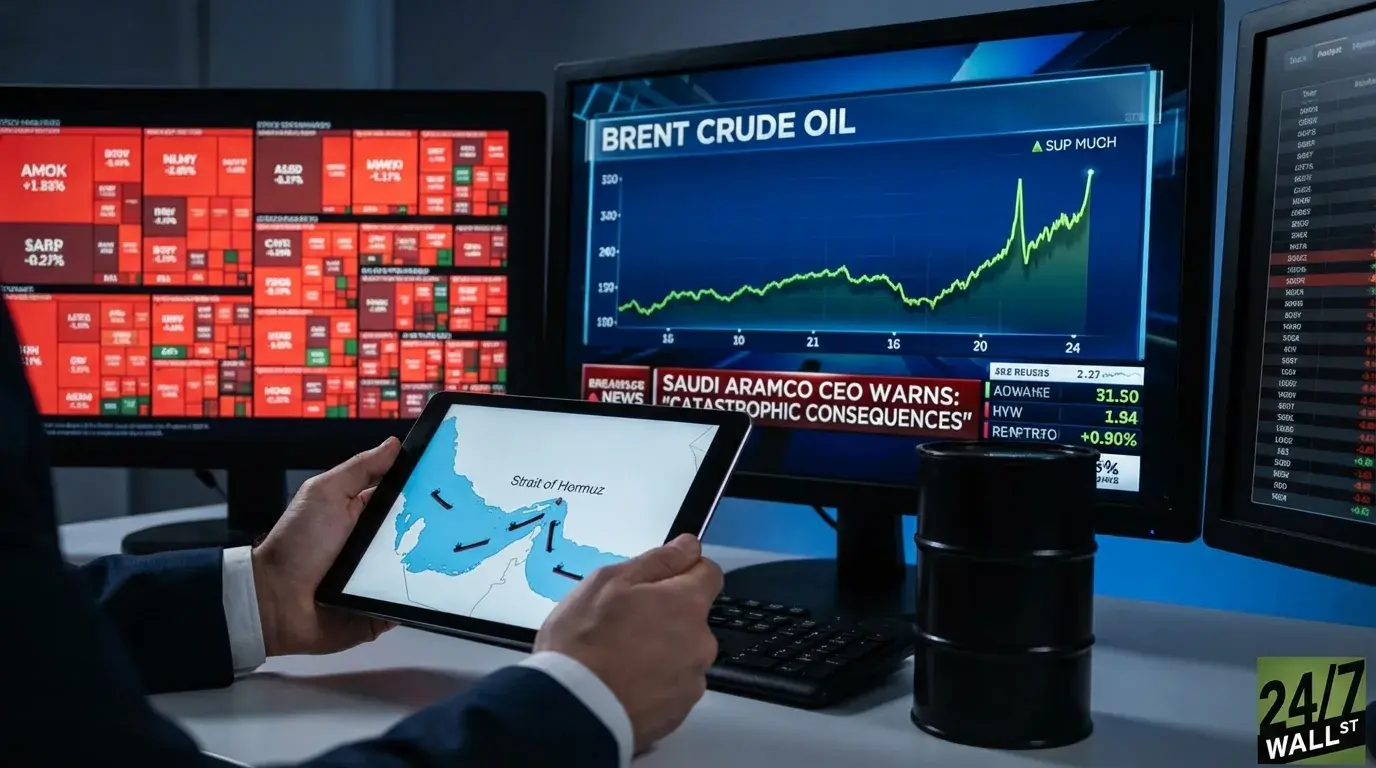
Saudi Aramco CEO Amin Nasser did not mince words on Tuesday. Speaking to reporters on an earnings call, he said: “The Iran war will have catastrophic consequences for the world’s oil market.” With Brent crude rocketing to a more than three-year high of nearly $120 a barrel on Monday before pulling back, and the International Energy Agency calling an emergency meeting to consider releasing strategic reserves, this is not a theoretical warning. For individual investors with any exposure to energy stocks, retirement accounts, or broad index funds, the math behind an oil shock is something worth understanding right now.
What the Strait of Hormuz Actually Means for Your Portfolio
Nasser’s warning centers on one geographic chokepoint: the Strait of Hormuz. Oil shipments have been largely blocked from using the shipping artery, where normally roughly 20% of the world’s oil passes through daily. Iran’s Revolutionary Guards stated they would not allow “one litre of oil” to be shipped from the Middle East if U.S. and Israeli attacks continue. Nasser called this “by far the biggest crisis the region’s oil and gas industry has faced.”
History offers a useful reference point. The 1973 Arab oil embargo, which blocked a far smaller share of global supply, sent oil prices up roughly 400%. The 1990 Gulf War triggered a spike closer to 100%. A sustained Hormuz closure would affect a larger share of global supply than either of those events, which is why Nasser’s language is not hyperbole.
The verdict on his warning: it is accurate, and likely understated. The real question for investors is not whether this matters globally. It is how it maps onto their specific portfolio and what to do about it.
The Oil Shock Mechanic: How Price Moves Flow Through to Investors
Oil price shocks affect investors through two distinct channels, and most retail investors only think about one of them.
The first channel is direct: energy stocks rise when oil prices rise. ExxonMobil is the clearest example in the U.S. market. XOM shares are up about 24% year-to-date in 2026 XOM shares are up about 24% year-to-date and 38% over the past year, reflecting how directly integrated oil majors benefit from rising crude.
That performance is underpinned by ExxonMobil’s record production of record production of 4.7 million oil-equivalent barrels per day in full-year 2025, the highest in over 40 years, meaning more volume is exposed to any price increase than at almost any point in its history. As a rough rule of thumb, every $10-per-barrel increase in oil prices affects ExxonMobil’s annual earnings by approximately $2 billion or more. That is an illustrative estimate based on industry convention, not a precise figure, but it captures the leverage that integrated oil majors carry to crude prices.
The second channel is indirect and often overlooked: oil shocks act as a tax on the broader economy. Higher energy costs compress margins across airlines, manufacturers, retailers, and agriculture. Aramco’s Nasser noted the crisis has upended shipping and insurance sectors and promises drastic domino effects on aviation, agriculture, automotive, and other industries. That means even investors with zero energy holdings are exposed through the rest of their portfolio.
Two Investor Profiles, Two Very Different Situations
Consider a 55-year-old with a retirement account split roughly in line with the S&P 500. Energy stocks make up only about 3% to 4% of the S&P 500 by weight, so direct energy exposure in a broad index fund is modest. For an investor in this position, an oil shock is likely a net negative: the indirect economic damage from higher energy costs rippling through the rest of the market typically outweighs the benefit of a small energy allocation.
Now consider a 45-year-old who holds 20% of their portfolio in individual energy stocks or energy-focused ETFs. That investor has been well-rewarded through early 2026, but they are also carrying concentrated exposure to geopolitical risk that can reverse quickly. Brent crude, which hit nearly $120 on Monday, pulled back toward $92 on Tuesday after President Trump suggested the war could end soon. That dramatic intraday reversal in the world’s most-traded commodity illustrates exactly how fast concentrated energy positions can move in both directions.
The VIX, a measure of expected market volatility, sat at 25.50 as of March 9, placing it in the elevated uncertainty range and in the 92nd percentile of the past year’s readings. That is not panic territory, but it reflects real and sustained anxiety across the market.
The Diversification Argument, Made Concrete
One of the more striking data points today comes from Vertex Pharmaceuticals, which the transcript above identified as the biggest individual gainer in the S&P 500 on Tuesday, up 10% on the success of a late-stage kidney disease drug trial. Vertex’s revenue comes from cystic fibrosis treatments, gene therapy, and a recently launched non-opioid pain medication. In Q4 2025, Vertex posted revenue of $3.19 billion, up 15% from the prior year. None of that growth has any connection to oil prices.
Year-to-date, VRTX shares are up about 10% while XOM has gained roughly 24%. Over the past year, VRTX is essentially flat while XOM is up 38%. They move for completely different reasons, and a portfolio holding both carries less concentrated exposure to any single geopolitical event. That is what diversification actually means in practice: owning assets whose earnings drivers do not share the same risk.
What to Do With This Information
Start by understanding your actual energy exposure. Log into your brokerage or retirement account and look at sector weights. If you hold a broad S&P 500 index fund, your energy exposure is small by design. If you hold individual energy stocks or sector ETFs, calculate what percentage of your total portfolio they represent and ask whether you are comfortable with that position moving 20% to 30% in either direction over days, not months.
If you are overweight energy and want to reduce concentration risk without abandoning the sector entirely, consider trimming to a weight closer to the S&P 500’s natural allocation. The upside from here depends on how long the Hormuz disruption continues. ExxonMobil has already evacuated non-essential employees from Middle East operations, but despite 43 consecutive years of dividend growth and a $20 billion share repurchase plan through 2026, the stock is trading well above analyst consensus. Eighteen analysts carry a consensus Hold rating with an average price target of $143, below where shares trade today, suggesting the market may already be pricing in an optimistic scenario for the conflict.
Nasser is right that the consequences of a prolonged Hormuz disruption would be catastrophic. What he cannot tell you is how long it lasts. That uncertainty is exactly why no single commodity-linked position, however well-timed, should dominate a retirement portfolio. The investors best positioned to weather this are the ones who benefited from energy’s run in early 2026 without betting the account on it continuing.