Small-Cap Oil Producer Hits 50 Consecutive Dividends With a 10.6% Yield, But the Cushion Is Thin

Photo of David Beren
By David Beren Published

Quick Read

  • Evolution Petroleum (EPM) maintained its 50th consecutive quarterly dividend at $0.12 per share, yielding 10.5%, despite Q2 net income of only $1.07 million against dividend payments of $4.2 million; adjusted EBITDA grew 41% year-over-year to $8.0 million with lease operating expenses down to $16.96 per BOE, while trailing twelve-month operating cash flow covered dividends 1.87x.

  • Natural gas tailwinds and a shift toward capital-light minerals and royalty acquisitions are sustaining Evolution’s dividend payout, but structural oil price weakness, $54.5 million in debt against only $13.5 million in liquidity, and a thin earnings cushion expose the streak to commodity volatility.

  • If you're focused on picking the right stocks and ETFs you may be missing the bigger picture: retirement income. That is exactly what The Definitive Guide to Retirement Income was created to solve, and it's free today. Read more here
This post may contain links from our sponsors and affiliates, and Flywheel Publishing may receive compensation for actions taken through them.
Small-Cap Oil Producer Hits 50 Consecutive Dividends With a 10.6% Yield, But the Cushion Is Thin

© tonda / Getty Images

Founded in 2003, Evolution Petroleum (NYSE:EPM) is focused on developing and producing onshore oil and natural gas properties in the US and just declared its 50th consecutive quarterly dividend, a milestone that puts it in rare company among small-cap energy producers. With the stock at $4.48 and the annualized payout at $0.48 per share, the implied yield is roughly 10.6% – nearly 577 basis points above the 10-year Treasury at 4.28%, and this spread demands scrutiny.

The Math Behind the Milestone

In Q2 FY2026 (ending December 2025), Evolution Petroleum reported net income of $1.1 million and paid $4.2 million in dividends. Operating cash flow of $5.425 million covered the dividend payment for the quarter. The company has maintained $0.12 per share every quarter since Q3 2022, never wavering even through net losses.

An infographic titled 'The 50-Quarter Streak: Is Evolution’s 10% Yield Sustainable or a Final Bow?' analyzes Evolution Petroleum Corporation (EPM, NYSE). The top section provides company details: Price ~$4.10, Annualized Dividend: $0.48, Implied Yield: ~10%. The infographic is divided into four main sections using a light blue and green color scheme with various icons and charts. The first section, 'THE MATH BEHIND THE MILESTONE,' highlights the 50th Consecutive Quarterly Dividend Declared for Q2 FY2026. It shows Q2 Dividend Payment estimated at ~$4.2M, Q2 Net Income at $1.07M (Net Income < Dividend), and Q2 Operating Cash Flow at $5.425M, which covers the dividend. The Trailing Twelve-Month Operating Cash Flow Coverage is 1.87x. A timeline indicates the dividend increased to $0.12 in Q3 2022 and was maintained for 20 consecutive quarters through Q2 FY2026, with a quote from CEO Kelly Loyd. The second section, 'WHAT'S HOLDING IT UP,' presents four key factors: Adjusted EBITDA Growth (Q2 FY2026: $8.0M, +41% YoY), Cost Discipline (LOE per BOE: $16.96, improved from $20.05 YoY), Natural Gas Tailwinds (Q2 FY2026 Realized Gas Prices: +22% YoY), and a Capital-Light Strategy (Royalty/Mineral Acquisitions with zero additional capex wells). The third section, 'THE RISKS THAT MATTER,' outlines three concerns: Debt & Liquidity (Outstanding Debt: $54.5M, Total Liquidity: $13.5M), Thin Net Income (Q2 FY2026 Net Income: $1.07M, a narrow earnings cushion), and Commodity Volatility (Oil Prices down 16% YoY, NGL Prices down 12% YoY in Q2 FY2026). The final section, 'DIVIDEND HISTORY CONTEXT,' shows a line graph illustrating dividend per share from $0.10 (2013-2014) to $0.025 (2020), then increasing to $0.12 (Q3 2022 - Present), along with text explaining the streak was tested previously. An outlook statement at the bottom discusses the minerals pivot and natural gas exposure as key arguments for streak continuation, balanced against structural oil price weakness and thin coverage. Data is sourced from Evolution Petroleum Corporation Filings, Alpha Vantage Data, as of March 18, 2026.
24/7 Wall St.
This infographic analyzes Evolution Petroleum’s (EPM) financial performance to assess the sustainability of its 50-consecutive quarterly dividend streak and 10% yield. It details the company’s Q2 FY2026 metrics, supporting factors, and significant risks impacting dividend coverage.

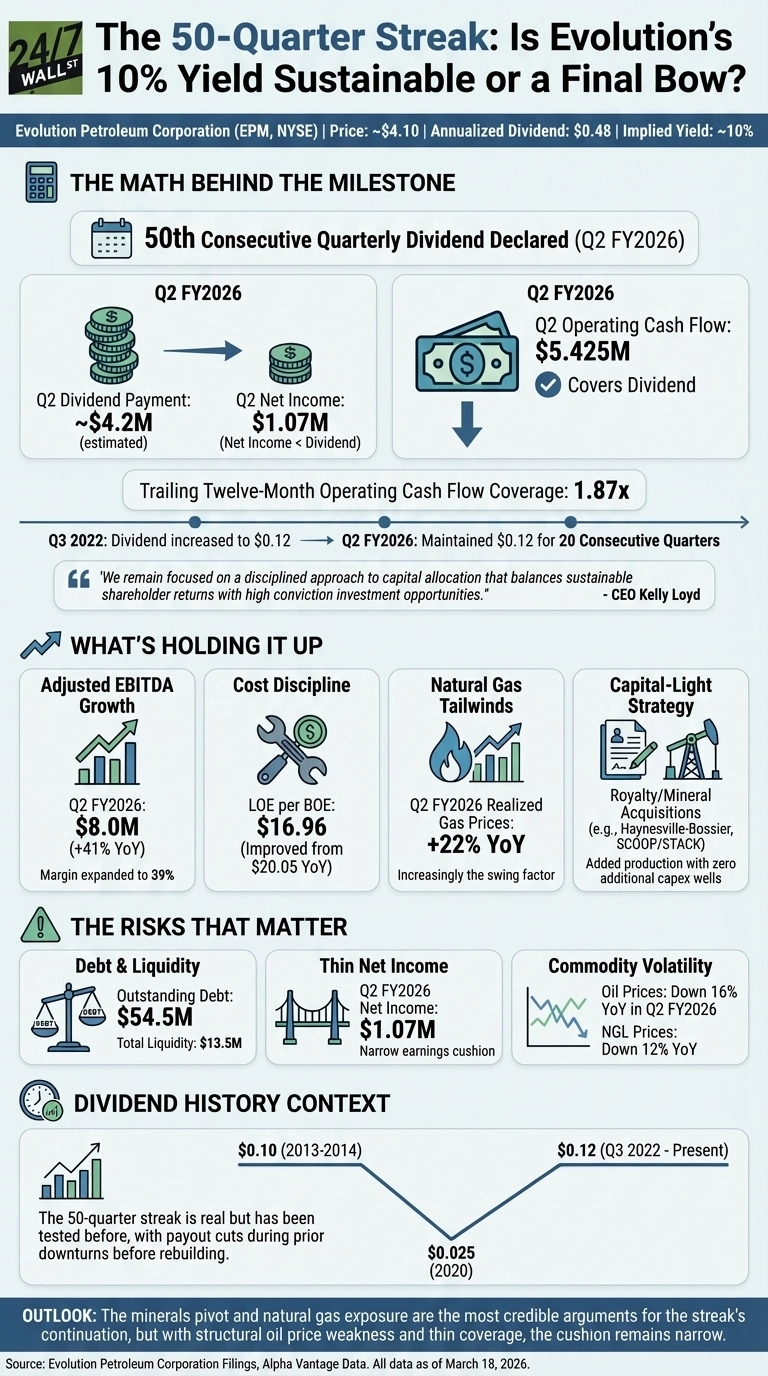
CEO Kelly Loyd framed the outlook on the Q2 call: “We remain focused on a disciplined approach to capital allocation that balances sustainable shareholder returns with high conviction investment opportunities.”

What’s Actually Holding It Up

The headline earnings figure understates cash generation. Adjusted EBITDA jumped 41% year-over-year to $8.0 million, with margins expanding to 39% from 28% the prior year. Lease operating expenses fell to $16.96 per BOE from $20.05, reflecting genuine cost discipline. On a trailing twelve-month basis, operating cash flow covered dividends at 1.87x.

Natural gas is increasingly the swing factor, as Henry Hub prices spiked to $7.72 in January 2026 before retreating to $3.62 in February, and Evolution’s realized natural gas prices rose 22% year-over-year in Q2. WTI crude sat at $64.51 in February 2026, well below the $75.74 seen in January 2025.

Evolution has also been pivoting toward capital-light minerals and royalty acquisitions. Four Haynesville-Bossier deals totaling roughly $4.5 million added production with no incremental lifting costs. Loyd noted that “when oil prices are low, it presents compelling M&A opportunities rather than drilling opportunities.”

The Risks That Matter

Outstanding debt stands at $54.5 million, while total liquidity is only $13.5 million. The stock has rallied 30.14% year-to-date from $3.45 at year-end 2025, compressing the yield from even higher levels. Three of four analysts covering the stock rate it a Buy, with a consensus price target of $5.06.

Evolution cut the payout from $0.10 in 2014 to $0.025 by mid-2020 during prior commodity downturns, then rebuilt it. The 50-quarter streak is real but has been tested before, and with oil prices structurally weaker and Q2 operating cash flow covering the dividend by a thin margin, the cushion is narrow. The minerals pivot and natural gas exposure are the most credible arguments this streak has room to continue.

Data Sources

  • Evolution Petroleum Q2 FY2026 earnings call highlights provided by user, covering dividend sustainability tension, EBITDA performance, and capital-light acquisition strategy.
  • Alpha Vantage dividend history confirming 50-quarter streak, $0.12 per share consistency since Q3 2022, and full payout timeline back to 2013.
  • Alpha Vantage cash flow statements providing annual and quarterly dividend coverage ratios and free cash flow analysis.
  • Alpha Vantage earnings call transcript (Q4 FY2025) providing CEO and CFO commentary on capital allocation, commodity outlook, and acquisition strategy.
Photo of David Beren
About the Author David Beren →

David Beren has been a Flywheel Publishing contributor since 2022. Writing for 24/7 Wall St. since 2023, David loves to write about topics of all shapes and sizes. As a technology expert, David focuses heavily on consumer electronics brands, automobiles, and general technology. He has previously written for LifeWire, formerly About.com.

As a part-time freelance writer, David’s “day job” has been working on and leading social media for multiple Fortune 100 brands. David loves the flexibility of this field and its ability to reach customers exactly where they like to spend their time. Additionally, David previously published his own blog, TmoNews.com, which reached 3 million readers in its first year.

In addition to freelance and social media work, David loves to spend time with his family and children and relive the glory days of video game consoles by playing any retro game console he can get his hands on.

Featured Reads

Our top personal finance-related articles today. Your wallet will thank you later.

Continue Reading

Top Gaining Stocks

ALB Vol: 2,898,719
+$10.86
+6.93%
$167.56
PLTR Vol: 57,503,716
+$10.16
+6.74%
$160.84
NCLH Vol: 24,239,338
+$1.17
+6.17%
$20.12
MHK Vol: 1,346,194
+$5.62
+5.84%
$101.83
RCL Vol: 3,828,936
+$15.31
+5.81%
$278.96

Top Losing Stocks

EL Vol: 9,878,489
-$6.63
7.72%
$79.29
ENPH Vol: 5,869,325
-$3.35
7.59%
$40.76
FICO Vol: 460,617
-$64.29
5.70%
$1,063.33
CNC Vol: 9,827,468
-$1.59
4.62%
$32.81
MU Vol: 54,804,580
-$18.55
4.39%
$404.35