Chip maker Taiwan Semiconductor Manufacturing (NYSE:TSM | TSM Price Prediction) reported its Q4 2025 results in January, while Broadcom (NASDAQ:AVGO) filed its Q1 FY2026 results in March. Both are riding the same AI wave from structurally different positions: one builds fabs, the other designs chips and sells software.
Manufacturing Dominance Meets Custom Silicon Acceleration
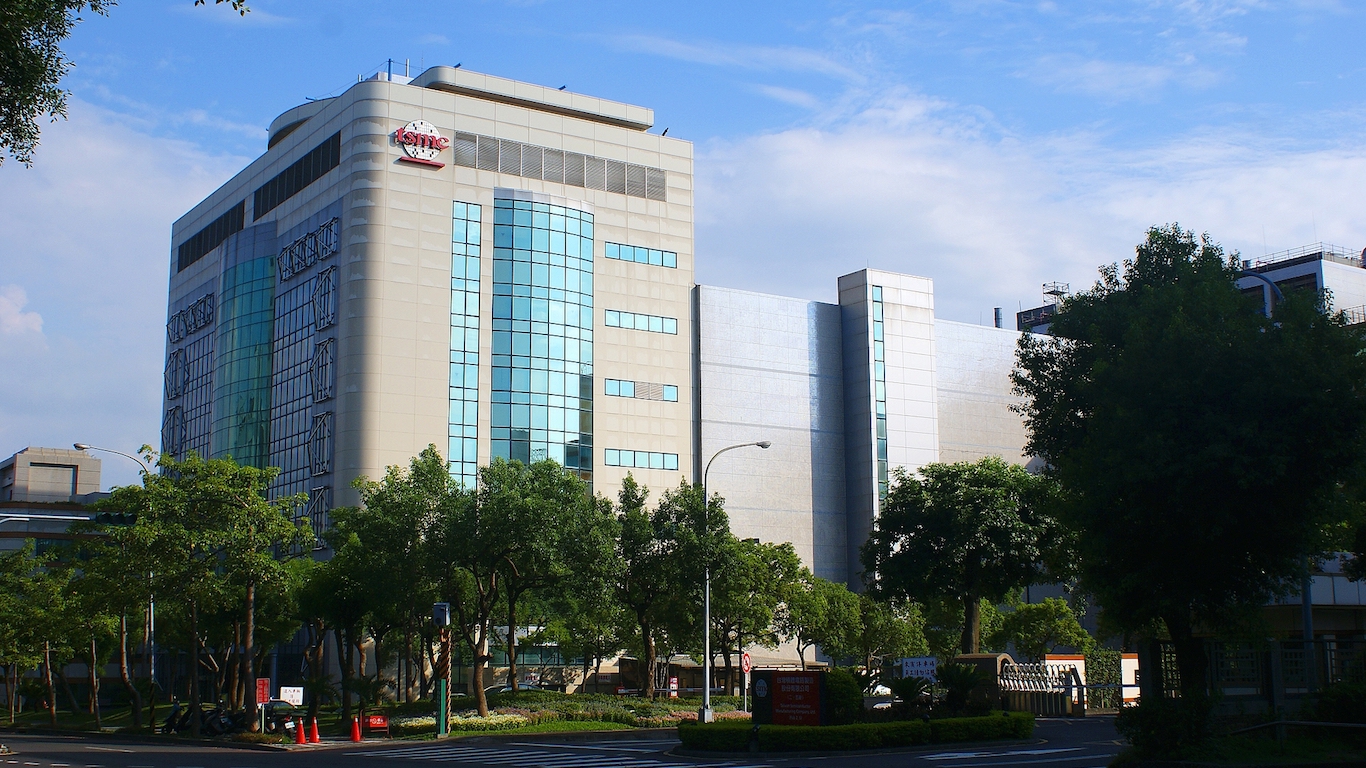
TSMC’s quarter demonstrated foundry leverage at scale. Revenue reached $33.73 billion, up 20.4% year-over-year, with gross margin of 62.3% exceeding the company’s own guidance range of 59% to 61%.
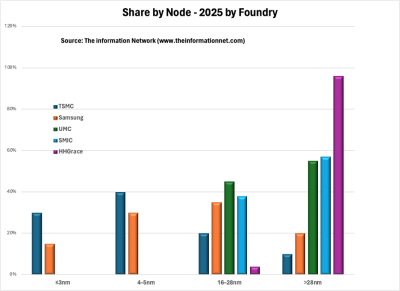
Advanced nodes drove the result. Chips built on 7nm processes and below accounted for 77% of wafer revenue, with 3nm alone contributing 28%, the nodes top tech companies rely on for their most demanding silicon.
CEO C.C. Wei confirmed he personally verified demand with cloud providers before committing to a 2026 capital expenditure budget of $52 billion to $56 billion, signaling conviction backed by customer conversations.
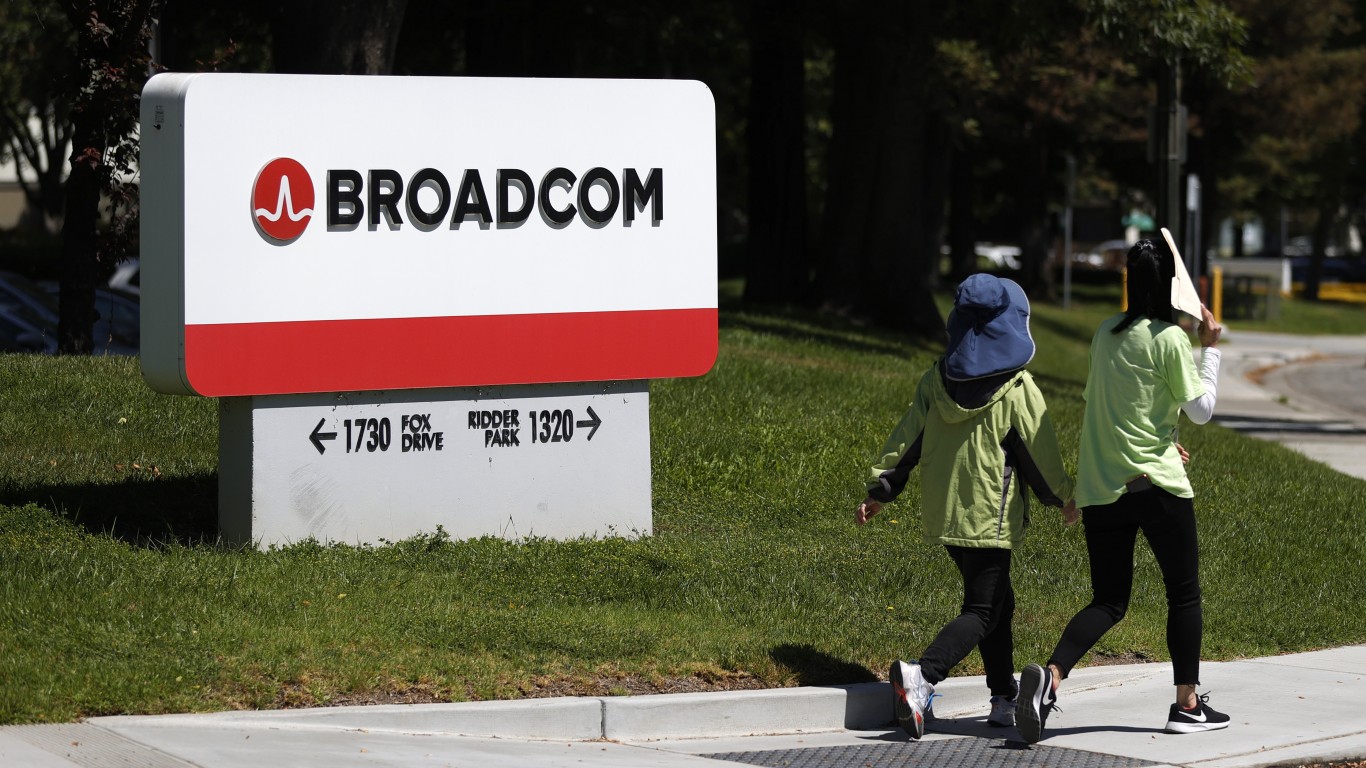
Broadcom’s quarter showed a different kind of acceleration. AI chip revenue hit $8.40 billion in Q1 FY2026, up 106% year-over-year and above the company’s own forecast. Q1 AI revenue of $8.4 billion grew 106% year-over-year, above the forecast, driven by robust demand for custom AI accelerators and AI networking.
The Semiconductor Solutions segment, which includes custom accelerators and Ethernet AI switches, grew 52% year-over-year to $12.52 billion and now represents 65% of total revenue.
| Business Driver | TSM | Broadcom |
|---|---|---|
| Revenue (Most Recent Quarter) | $33.73B (Q4 2025) | $19.31B (Q1 FY2026) |
| YoY Revenue Growth | 20.4% | 29.5% |
| AI Revenue Growth | Advanced nodes driving ~77% of wafer revenue | $8.4B, up 106% YoY |
| Adjusted EBITDA / Gross Margin | 62.3% gross margin | 68% adjusted EBITDA margin |
| 2026 Capex | $52B-$56B | ~$250M in Q1 alone (asset-light) |
Foundry Scale vs. Fabless Focus
TSMC’s $52 billion to $56 billion capex budget is both a moat and a constraint. Additionally, the company serves 534 customers across 305 distinct process technologies, capturing AI demand from virtually every major chip designer simultaneously, including Broadcom. The primary risk is geopolitical exposure tied to Taiwan’s concentration in the supply chain.
Broadcom’s asset-light structure produces a different financial profile. Free cash flow reached $8.01 billion in Q1, representing 41% of revenue. The company deployed $7.8 billion in share repurchases in that single quarter and authorized a new $10 billion buyback program through December 31, 2026. Hock Tan’s stated ambition: exceed $100 billion in AI sales by 2027. Key risks include customer concentration among hyperscale cloud providers and debt carried from the VMware acquisition.
What to Watch Next
TSMC’s early 2026 data already looks strong. January and February combined revenue hit $22.57 billion, up 29.9% year-over-year. Q1 2026 guidance calls for revenue of $34.6 billion to $35.8 billion with gross margin expanding to 63% to 65%. The long-term projection remains ambitious: AI chip revenue is projected to grow at nearly 60% CAGR from 2025 through 2029.
Broadcom’s Q2 guidance of approximately $22.0 billion in revenue, implying 47% year-over-year growth. The AI semiconductor revenue expected at $10.70 billion is the next number to track.
TSM vs. AVGO: Two Profiles, One AI Theme
TSM trades at a trailing P/E of roughly 33x with an analyst consensus target of $430.65, while Broadcom carries a trailing P/E near 62x and an analyst target of $472.01. On valuation, TSM offers more room. TSMC’s foundry position is irreplaceable in a way no single chip designer can replicate, giving it broad exposure to AI infrastructure demand.
Broadcom’s custom accelerator focus and generous capital return program represent a different risk-reward profile for those tracking the AI semiconductor space. Watch whether Broadcom’s software segment, which grew only roughly 1% year-over-year in Q1, begins pulling more weight — if it does, the margin story strengthens further.
Contact [email protected] for any questions or corrections.