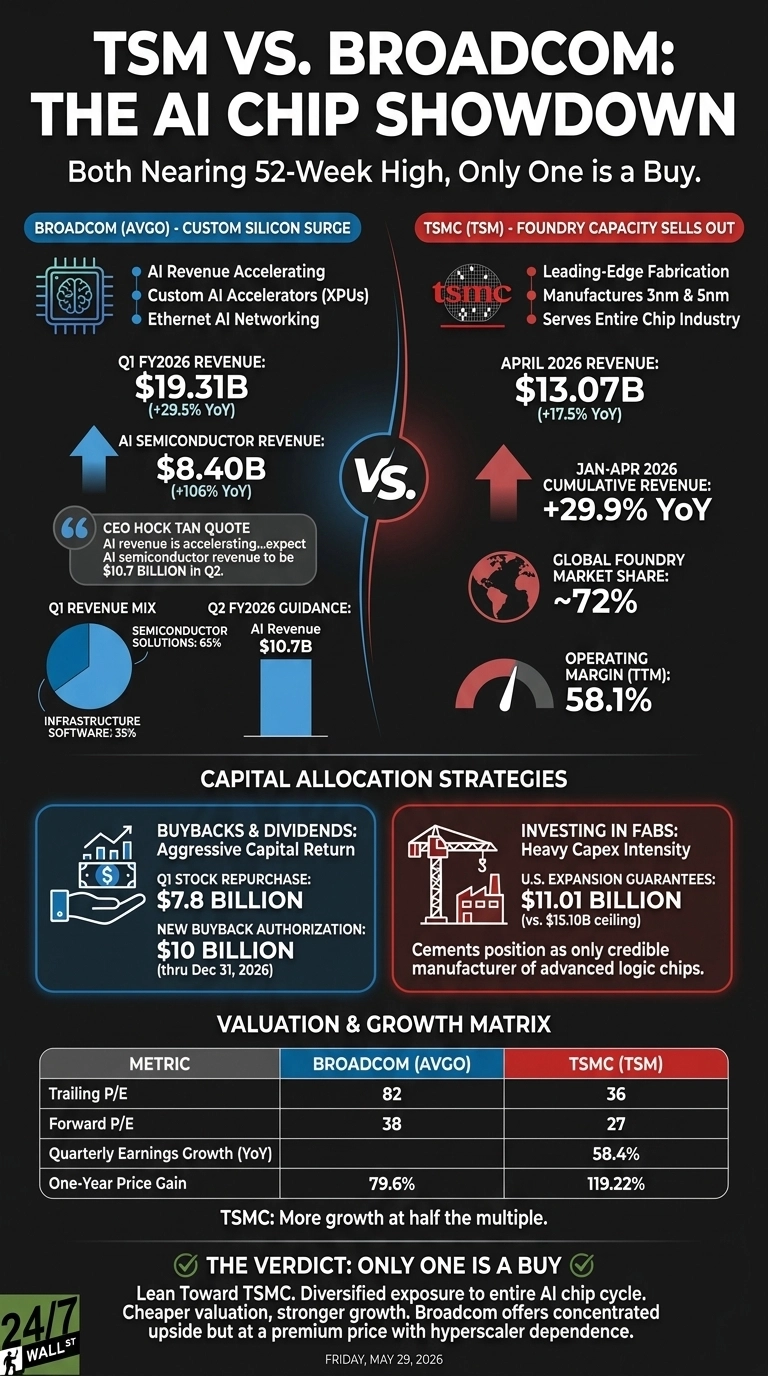
Broadcom (NASDAQ:AVGO | AVGO Price Prediction) and Taiwan Semiconductor Manufacturing (NYSE:TSM) just reported quarters that put both stocks within striking distance of fresh 52-week highs. Broadcom designs custom AI accelerators for a handful of hyperscalers.
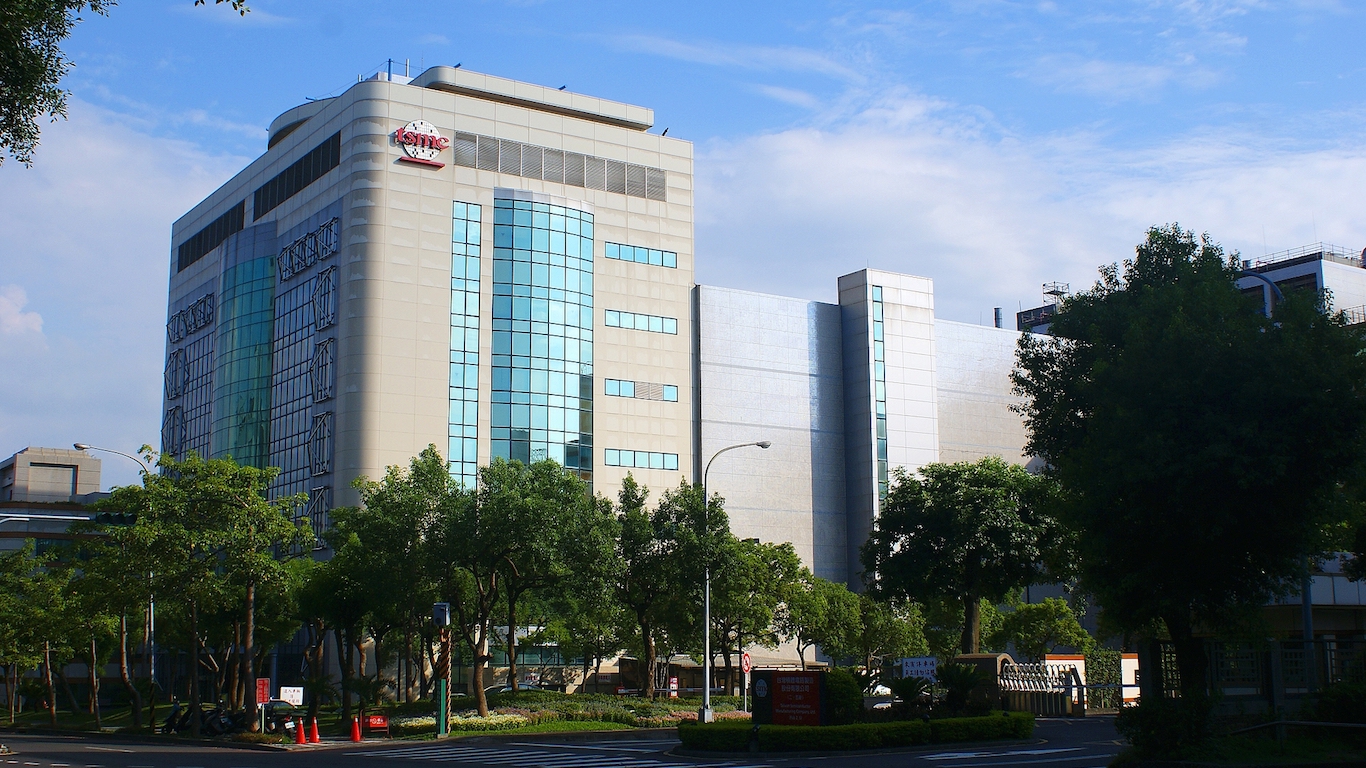
TSMC fabricates leading-edge chips for nearly every major designer on the planet, including Broadcom itself. Their results tell the same AI story from opposite ends of the supply chain.
Custom Silicon Surges, Foundry Capacity Sells Out
Broadcom’s Q1 FY2026 revenue hit $19.31 billion, up 29.5% year over year, with AI semiconductor sales reaching $8.40 billion and growing 106%. CEO Hock Tan told investors AI revenue is “accelerating, and we expect AI semiconductor revenue to be $10.7 billion in Q2.”
The Semiconductor Solutions segment now makes up 65% of total revenue, while VMware grew just 1% year over year. Software is along for the ride. Custom XPUs are doing the heavy lifting.
| Business Driver | Broadcom | TSMC |
| Main Growth Engine | Custom AI accelerators and Ethernet networking | Advanced node foundry capacity |
| Customer Mix | Concentrated hyperscalers | Entire chip industry |
| Operating Margin | 44.9% | 58.1% |
TSMC’s April update showed consolidated revenue of $13.07 billion, up 17.5% versus April 2025, with year-to-date sales up 29.9%. The foundry controls roughly 72% of global foundry market share and manufactures the 3nm and 5nm parts that NVIDIA, AMD, Apple, and Broadcom all depend on. Operating margin sits at 58.1%. When every designer fights for the same advanced node capacity, the toll collector wins.
One Buys Back Stock. The Other Pours Concrete in Arizona
Broadcom returned cash aggressively last quarter, repurchasing $7.8 billion in stock and authorizing a fresh $10 billion buyback through December 31, 2026. Tan’s playbook leans on financial engineering layered over a high-margin chip portfolio.
TSMC is doing the opposite. Its U.S. expansion guarantees alone reached $11.01 billion against a $15.10 billion board-approved ceiling, with new fabs spinning up in Arizona. That capex intensity drags free cash flow, but it cements TSMC as the only credible manufacturer of the most advanced logic chips for years to come.
Valuation is where the comparison sharpens. Broadcom trades at a trailing P/E of 82 and a forward P/E of 38. TSMC trades at a trailing P/E of 36 and a forward P/E of 27, with quarterly earnings growing 58.4% year over year. You get more growth at half the multiple.
The Next Catalyst Is Q2 AI Revenue and Taiwan Headlines
For Broadcom, I am watching whether AI sales actually clear the $10.7 billion Q2 guide. Polymarket traders assign a 97.4% probability to AI revenue topping $10.5 billion, but only 7% to clearing $12 billion. Hyperscaler order patterns can shift fast.
For TSMC, the swing factors are geopolitical noise around Taiwan, foreign exchange (already showing NT$5.9 billion in hedging losses year to date), and execution on Arizona ramp.
Why I Lean Toward TSMC Here
If I had to put new money to work today, I would lean TSMC. You are buying the entire AI chip cycle rather than a single designer’s hyperscaler relationships, at roughly 27 times forward earnings against TSM’s 119.22% one-year gain.
Broadcom’s 79.6% one-year run is impressive, but a trailing P/E of 82 leaves thin margin for any hyperscaler to pause orders. Investors seeking concentrated upside tied directly to custom silicon design wins may find AVGO the more targeted vehicle. For diversified exposure to every chip that matters, TSMC is the cleaner expression of the same thesis.
Contact [email protected] for any questions or corrections.