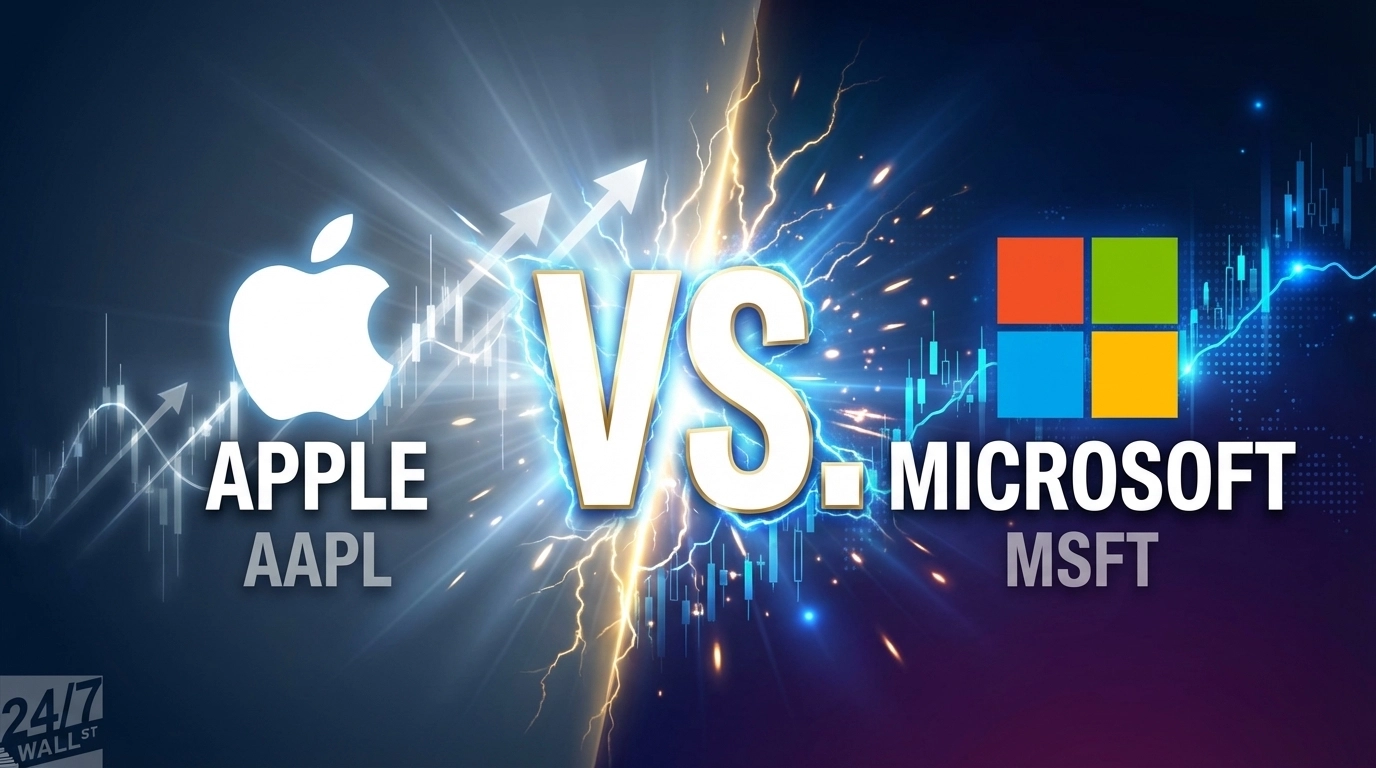
Apple (NASDAQ:AAPL | AAPL Price Prediction) and Microsoft (NASDAQ:MSFT) both reported fiscal second-quarter results within a day of each other in late January 2026, and the two quarters reveal two very different bets on what drives technology growth. One is monetizing a massive installed base of loyal hardware users. The other is building the infrastructure layer for an AI-driven enterprise economy.
iPhone Breaks Records. Azure Crosses $50 Billion.
Apple’s Q1 revenue of $143.76 billion beat the consensus estimate of $138.52 billion by 3.78%, powered by an iPhone segment that hit $85.27 billion, up 23.3% year over year and the best quarter the product has ever had.
Tim Cook called it “a remarkable, record-breaking quarter” driven by “unprecedented demand” across every geographic segment. Greater China alone surged to $25.53 billion from $18.51 billion a year earlier. Services reached $30.01 billion, up 14% year over year and an all-time high. Capital expenditures came in at just $2.37 billion, confirming the asset-light nature of the business.
Microsoft’s quarter looked structurally different. Revenue reached $81.27 billion, up 16.7% year over year, with Intelligent Cloud delivering $32.91 billion at 29% growth and Azure expanding 39% year over year.
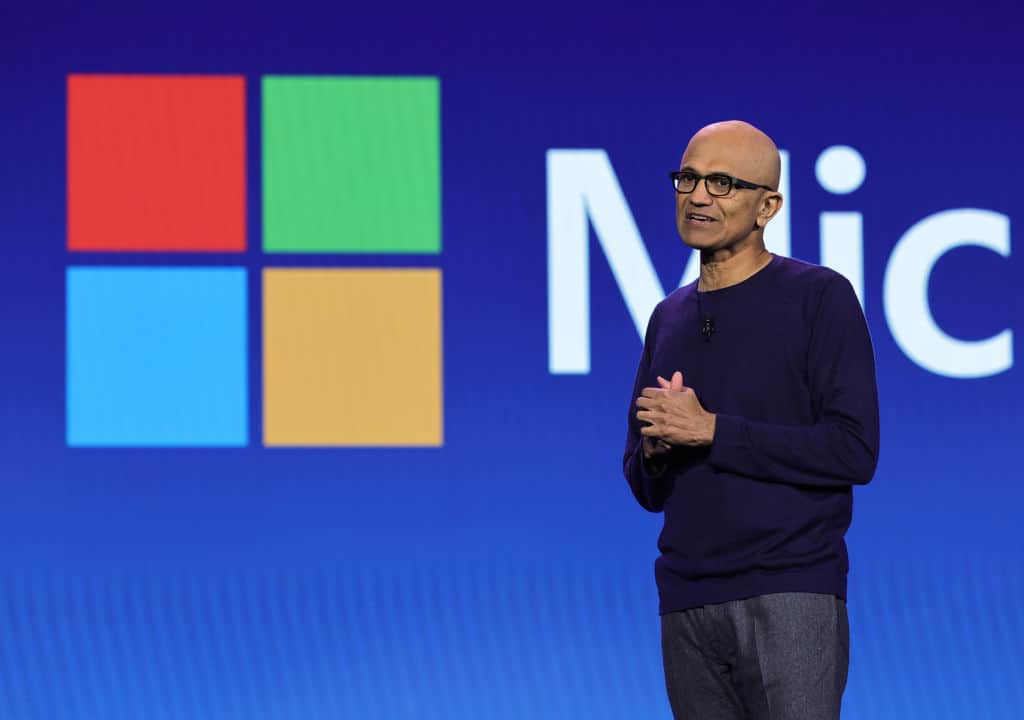
Microsoft Cloud crossed $51.50 billion in a single quarter for the first time. Satya Nadella told investors that “Microsoft has built an AI business that is larger than some of our biggest franchises.” The cost: capital expenditures hit $29.88 billion in the quarter, up 89% year over year.
| Business Driver | Apple (Q1 FY26) | Microsoft (Q2 FY26) |
|---|---|---|
| Main Growth Engine | iPhone + Services | Azure + AI Cloud |
| Revenue Growth YoY | +15.7% | +16.7% |
| Capex | $2.37B | $29.88B |
| EPS Beat vs. Estimate | +6.34% | +7.57% |
One Harvests. The Other Builds.
Apple’s strategy monetizes a base spanning more than 2.5 billion active devices. Every iPhone sale pulls a customer deeper into a higher-margin Services ecosystem. Share buybacks totaled $24.7 billion in the quarter, signaling confidence in cash generation over capital reinvestment. The M5 chip, iPhone 17 lineup, and Apple Intelligence features extend the hardware refresh cycle without dramatic capital outlays.
Microsoft is in full construction mode. The commercial remaining performance obligation of $625 billion, up 110% year over year represents contracted future revenue justifying the spending. The OpenAI partnership adds strategic depth: Microsoft holds roughly a 27% stake valued at approximately $135 billion, and OpenAI has contracted $250 billion in Azure services. That backlog is real, but so is the risk that AI returns remain unproven at scale.
| Lens | Apple | Microsoft |
|---|---|---|
| Core Bet | Hardware ecosystem + Services monetization | AI infrastructure + Enterprise cloud |
| Capital Model | Asset-light, buyback-heavy | Heavy capex, long-duration revenue |
| Key Vulnerability | China geopolitics, manufacturing concentration | AI ROI scrutiny, capex intensity |

China Recovery and Capex Scrutiny Will Drive the Next Chapter
For Apple, the Greater China recovery to $25.53 billion was a genuine positive, but trade tensions and geopolitical risk remain an overhang. Whether Apple Intelligence gains traction in China specifically could sustain demand through the next iPhone cycle. The YTD price decline of -5.88% suggests the market has not fully rewarded the strong quarter.
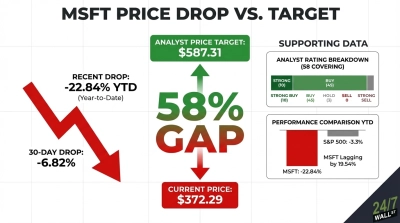
For Microsoft, the question is whether Azure’s guided 37-38% growth next quarter materializes and whether enterprise customers convert AI pilots into long-term contracts. The stock is down -23.45% year to date, a steeper pullback than Apple.
Valuation and Risk Profiles Compared
Both companies beat estimates and are growing revenue at roughly the same pace, but the risk profiles differ. Apple’s trailing P/E of 32x is higher than Microsoft’s trailing P/E of 23x, which on the surface favors Microsoft.
Microsoft’s valuation requires AI infrastructure returns that are still largely theoretical. Apple’s cash flows are already here, funding buybacks and compounding through Services. Investors focused on AI infrastructure exposure and enterprise cloud acceleration will find Microsoft a more direct play on that thesis.
Apple’s record iPhone quarter, services momentum, and disciplined capital return program represent a distinct risk profile at this stage of the cycle.