Active management in large-cap growth has a credibility problem. Most active funds charge more, trade more, and deliver less than the index over time. Fidelity Fundamental Large Cap Growth ETF (NYSEARCA:FFLG) is trying to change that narrative, and its recent results give it a real argument. Whether it belongs in a portfolio depends on what role you’re trying to fill and what you’re willing to give up.
What Fidelity Is Actually Building Here
FFLG’s mandate is straightforward: seek long-term growth of capital by normally investing at least 80% of assets in equity securities of companies with large market capitalizations that Fidelity Management & Research Company LLC believes have above-average growth potential. The key phrase is “believes have above-average growth potential.” This is an actively managed fund where a human manager makes conviction calls, not a rules-based index that buys whatever qualifies.
Fidelity’s analysts evaluate businesses on earnings growth trajectory, competitive positioning, and long-term cash flow potential. The fund concentrates in its highest-conviction names, which is why NVIDIA alone represents 15% of the portfolio. When that call is right, it amplifies returns. When it’s wrong, it amplifies pain.
The sector tilt reflects where the manager sees the most durable growth. Information Technology sits at nearly 50% of the fund, with Communication Services adding another 17%, creating a combined two-thirds exposure to tech and tech-adjacent businesses, a deliberate bet on the sectors producing the fastest earnings growth in the modern economy.
One Year of Proof, Five Years of Questions
The recent performance case for FFLG is genuine. Over the past year, FFLG returned 25%, while QQQ returned 23% and the S&P 500 returned 16% over the same period. For an actively managed fund to beat both benchmarks is meaningful, and Fidelity’s fundamental process deserves credit.
The five-year picture is harder to defend. Since inception in early 2021, FFLG has returned 49%. Over the same window, QQQ returned 80% and SPY returned 64%. That gap is the honest cost of active management during a period when passive growth indices recovered sharply from the 2022 drawdown. Investors need to weigh a one-year win against a five-year shortfall.
Concentration, Cost, and Rate Risk Are the Real Risks Here
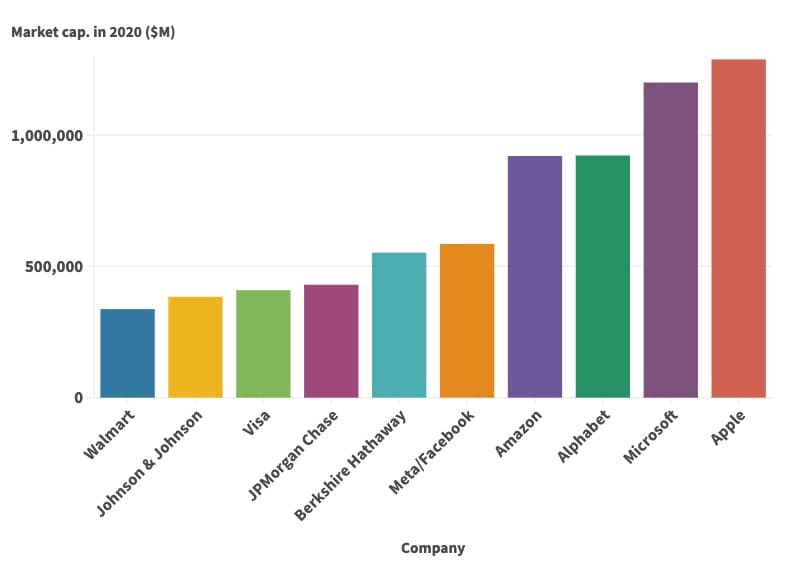
The first tradeoff is concentration risk. The top six holdings (NVIDIA, Apple, Microsoft, Amazon, Alphabet, and Meta) together represent a commanding share of the portfolio, with NVIDIA’s 15% weight alone making it a single-stock risk factor. NVIDIA is down nearly 5% year-to-date, which directly pressures FFLG’s year-to-date decline of nearly 6%. The biggest winners can quickly become the biggest drag.
The second tradeoff is cost. FFLG carries a 0.4% expense ratio. That’s reasonable for active management, but still multiples of what a passive large-cap growth index fund charges. Over a decade, that difference compounds against you if the manager doesn’t consistently outperform.
The third tradeoff is macro sensitivity. The VIX is near 25, up sharply from a month ago, sitting in the elevated uncertainty range. Growth stocks carry higher valuation multiples and are more sensitive to rate moves. The 10-year Treasury yield has risen to about 4.3%, up from lows earlier this year. Rising yields compress the present value of future earnings, which is exactly where growth stocks live. Consumer sentiment sits at 56.6, well below the 80 threshold that separates pessimistic from neutral, adding another headwind for consumer-facing names in the portfolio.
Who Should Actually Own This
FFLG fits best as a core growth allocation for investors with a 10-plus year horizon who want active fundamental selection within large-cap tech. The fund has been running since February 2021 and has a track record long enough to evaluate through multiple market environments. Portfolio turnover of 52% suggests the manager holds positions with conviction rather than trading reactively, which is a reasonable signal for a buy-and-hold investor.
It is not a fit for income seekers. The dividend yield is essentially zero, making this a pure capital appreciation vehicle. It’s also not a fit for investors who want broad diversification; two-thirds of the fund sits in technology and communication services, and the geographic exposure is 94% United States.
FFLG works as a growth engine for long-term investors who trust Fidelity’s fundamental process and accept that active management means accepting a manager’s judgment, including the years when that judgment trails the index.
Contact [email protected] for any questions or corrections.