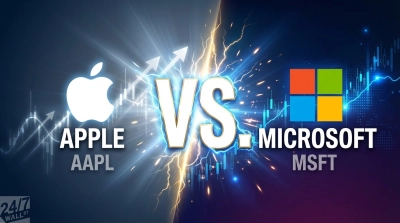
Apple (NASDAQ:AAPL | AAPL Price Prediction) and Tesla (NASDAQ:TSLA) both reported earnings this year, and the results diverged sharply. Apple delivered a record-breaking quarter built on hardware demand and a growing services flywheel while Tesla reported shrinking revenue, collapsing net income, and a pivot story that remains more promise than proof. In this article, we compare the two giants.
iPhone Records and Energy Wins Tell Two Very Different Stories
Apple’s quarter was defined by iPhone. iPhone revenue reached $85.27 billion, up 23.3% year over year, making it the best iPhone quarter in company history. Services followed, hitting an all-time record of $30.01 billion, up 14% year over year. Total revenue came in at $143.76 billion, beating estimates of $138.52 billion by 3.78%.
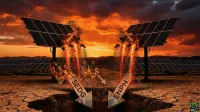
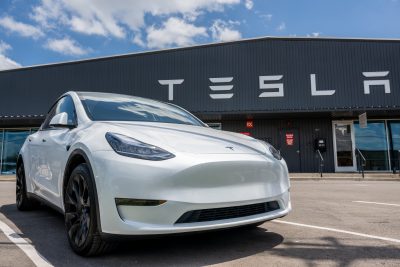
Tesla’s picture was harder to read. Total Q4 revenue fell 3.14% year over year to $24.9 billion, and GAAP net income collapsed 63.7% to $840 million. Vehicle deliveries dropped sharply, falling 16% year over year to 418,227 units. The bright spots were narrow: Energy Generation and Storage grew 25% year over year to $3.837 billion with record Q4 deployments of 14.2 GWh, and gross margin expanded 386 basis points to 20.1%.
| Business Driver | Apple (Q1 FY26) | Tesla (Q4 FY25) |
|---|---|---|
| Revenue Growth YoY | +15.7% | -3.1% |
| Core Growth Engine | iPhone + Services | Energy + FSD subscriptions |
| Net Income | $42.10B | $840M |
| Gross Margin | ~48.2% | 20.1% |

Premium Ecosystem vs. Autonomous Moonshot
Apple’s strategy is compounding. The installed base surpassed 2.5 billion active devices, and each new device pulls users deeper into the App Store, iCloud, Apple Music, and Apple TV+ ecosystem.
The M5 chip rollout across MacBook Pro and iPad Pro, combined with Apple Intelligence features, keeps hardware upgrades relevant. Greater China revenue surged to $25.53 billion from $18.51 billion a year earlier, a dramatic reversal after prior quarters of pressure.
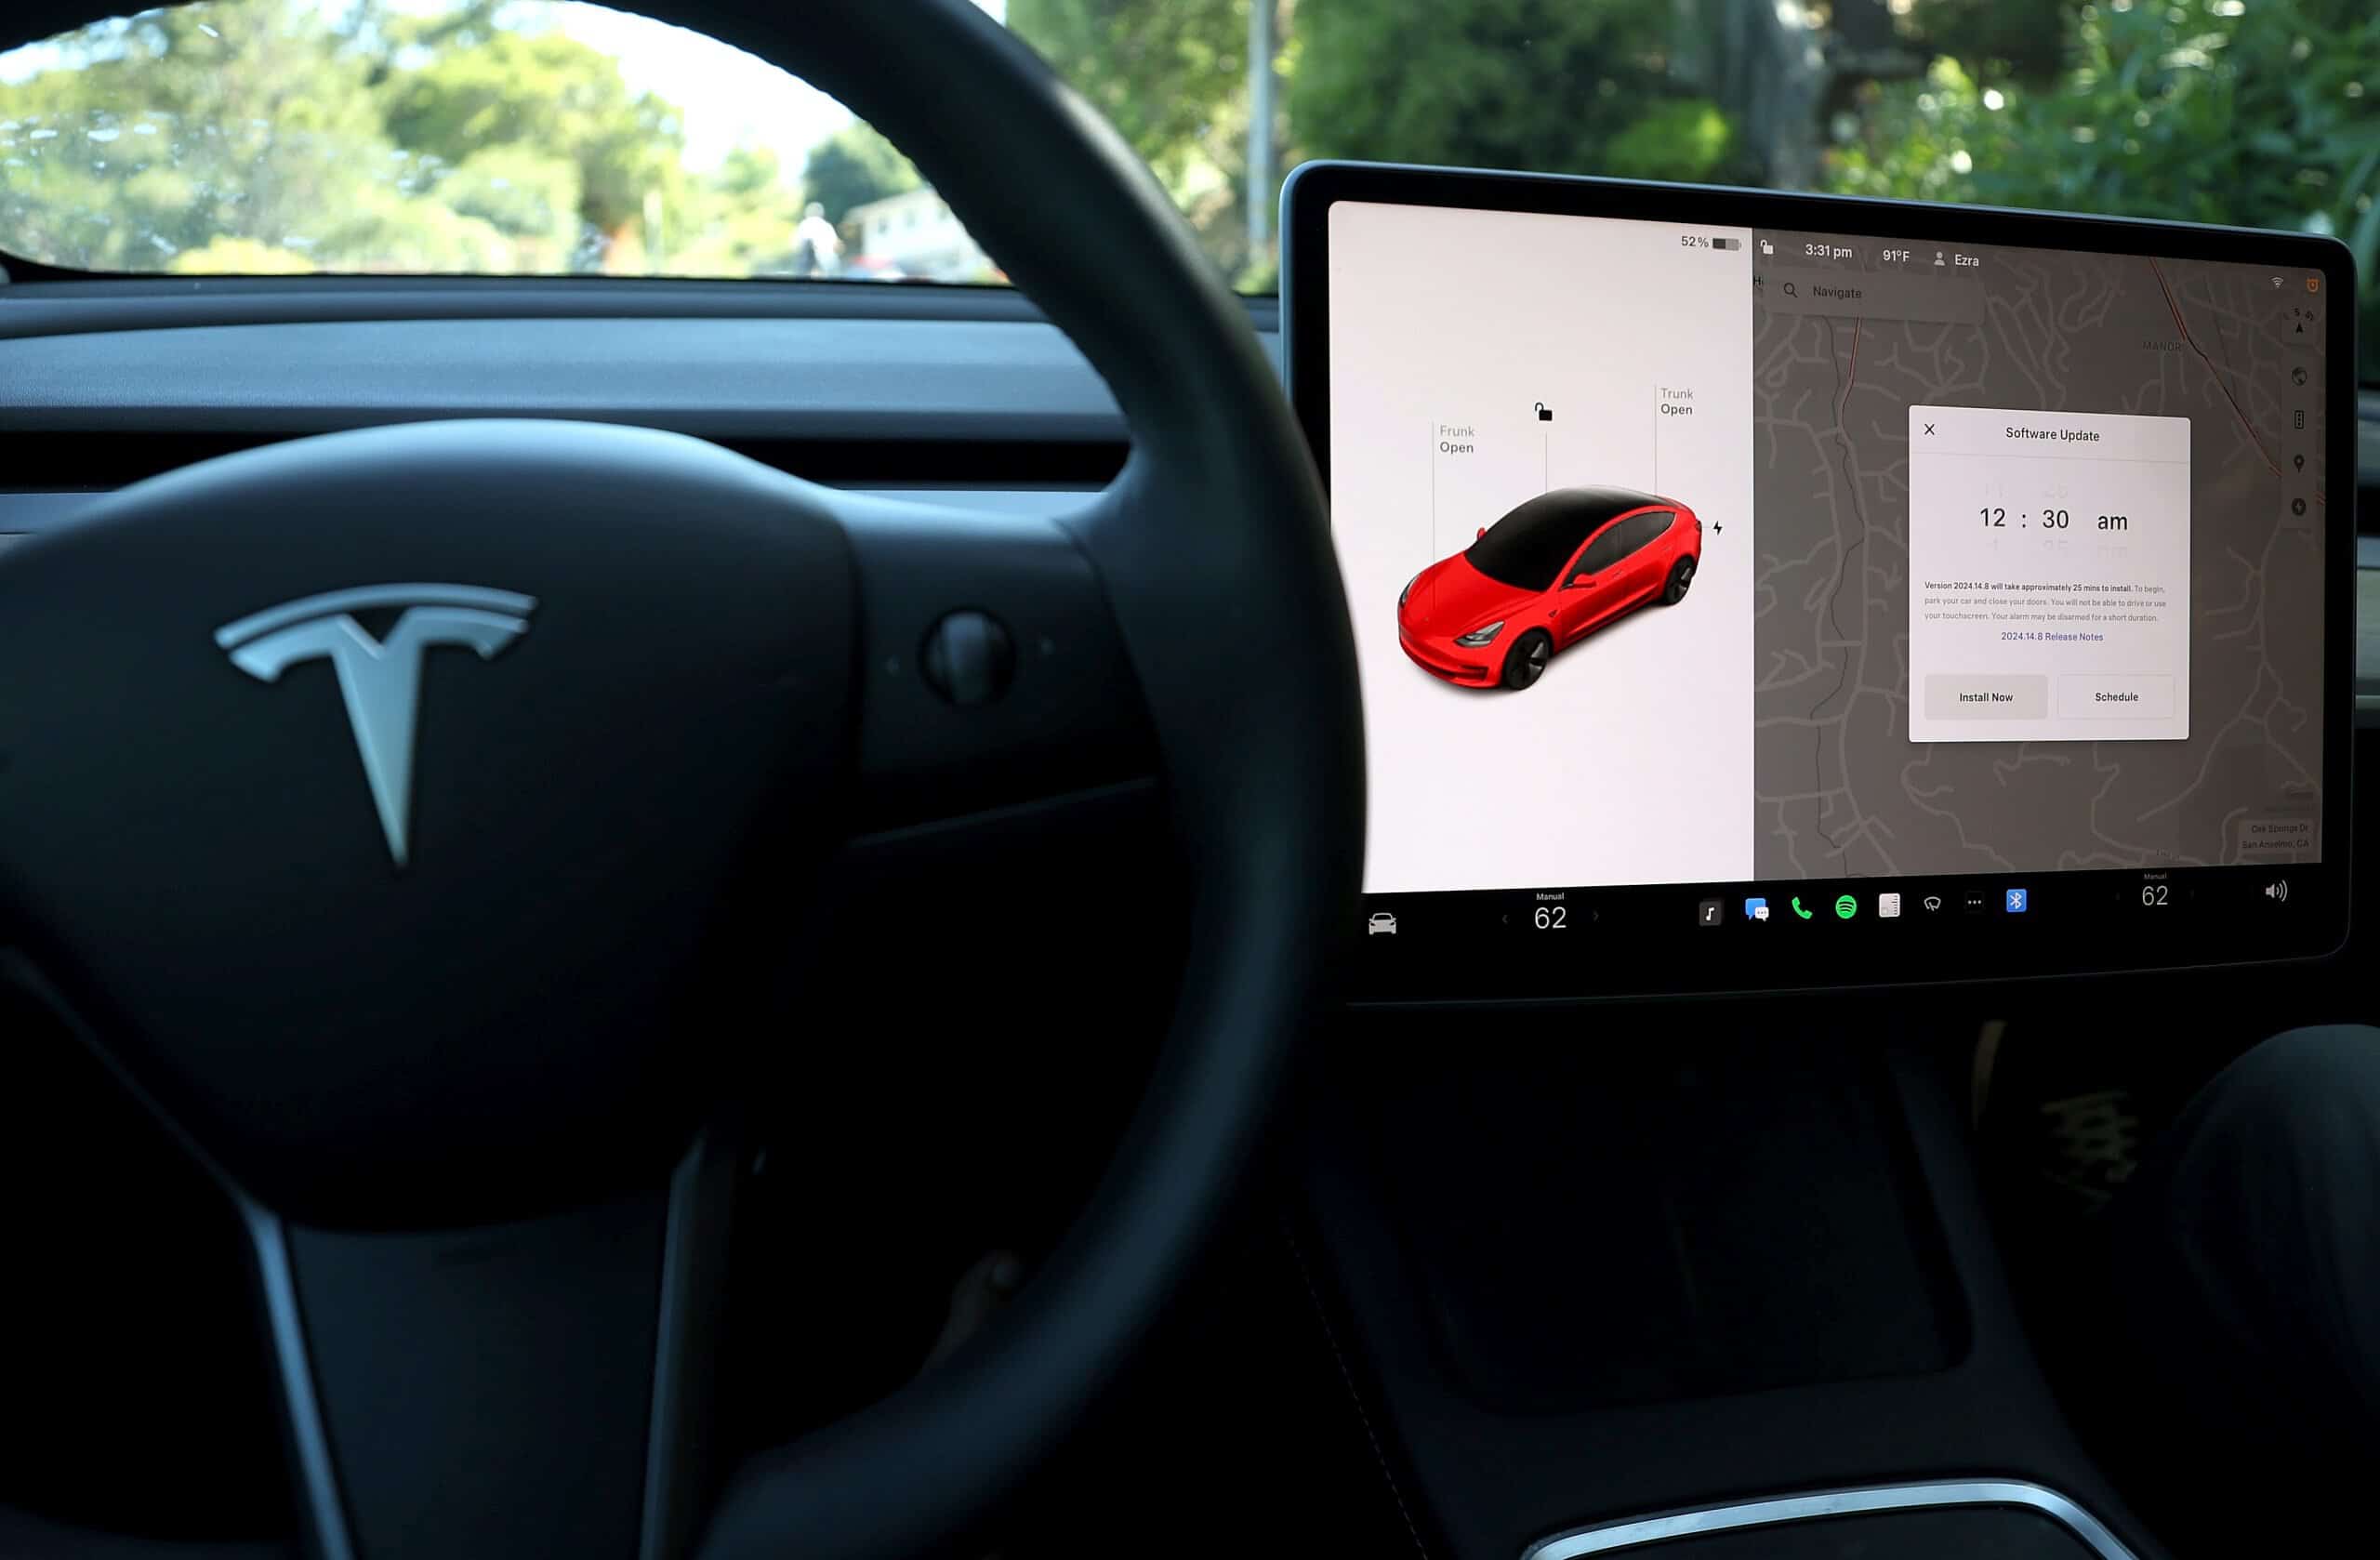
Tesla is making a different bet. Full Self-Driving subscriptions reached 1.1 million active users, up 38% year over year, and robotaxi driverless testing commenced in Austin in December 2025.
Robotaxi expansion is planned across Dallas, Houston, Phoenix, Miami, Orlando, Tampa, and Las Vegas in the first half of 2026. But operating expenses surged 39% year over year as AI and R&D spending accelerated, and the core automotive business continues to shrink.
| Strategic Lens | Apple | Tesla |
|---|---|---|
| Core Bet | Ecosystem lock-in via hardware and services | Autonomous driving and energy storage |
| Capital Return | $24.7B buybacks in Q1; $100B program authorized | No dividend or buyback |
| Key Vulnerability | China geopolitical exposure; Google search deal scrutiny | Delivery declines; brand headwinds in Europe |
Robotaxi Approval and China Exposure Will Decide the Next Chapter
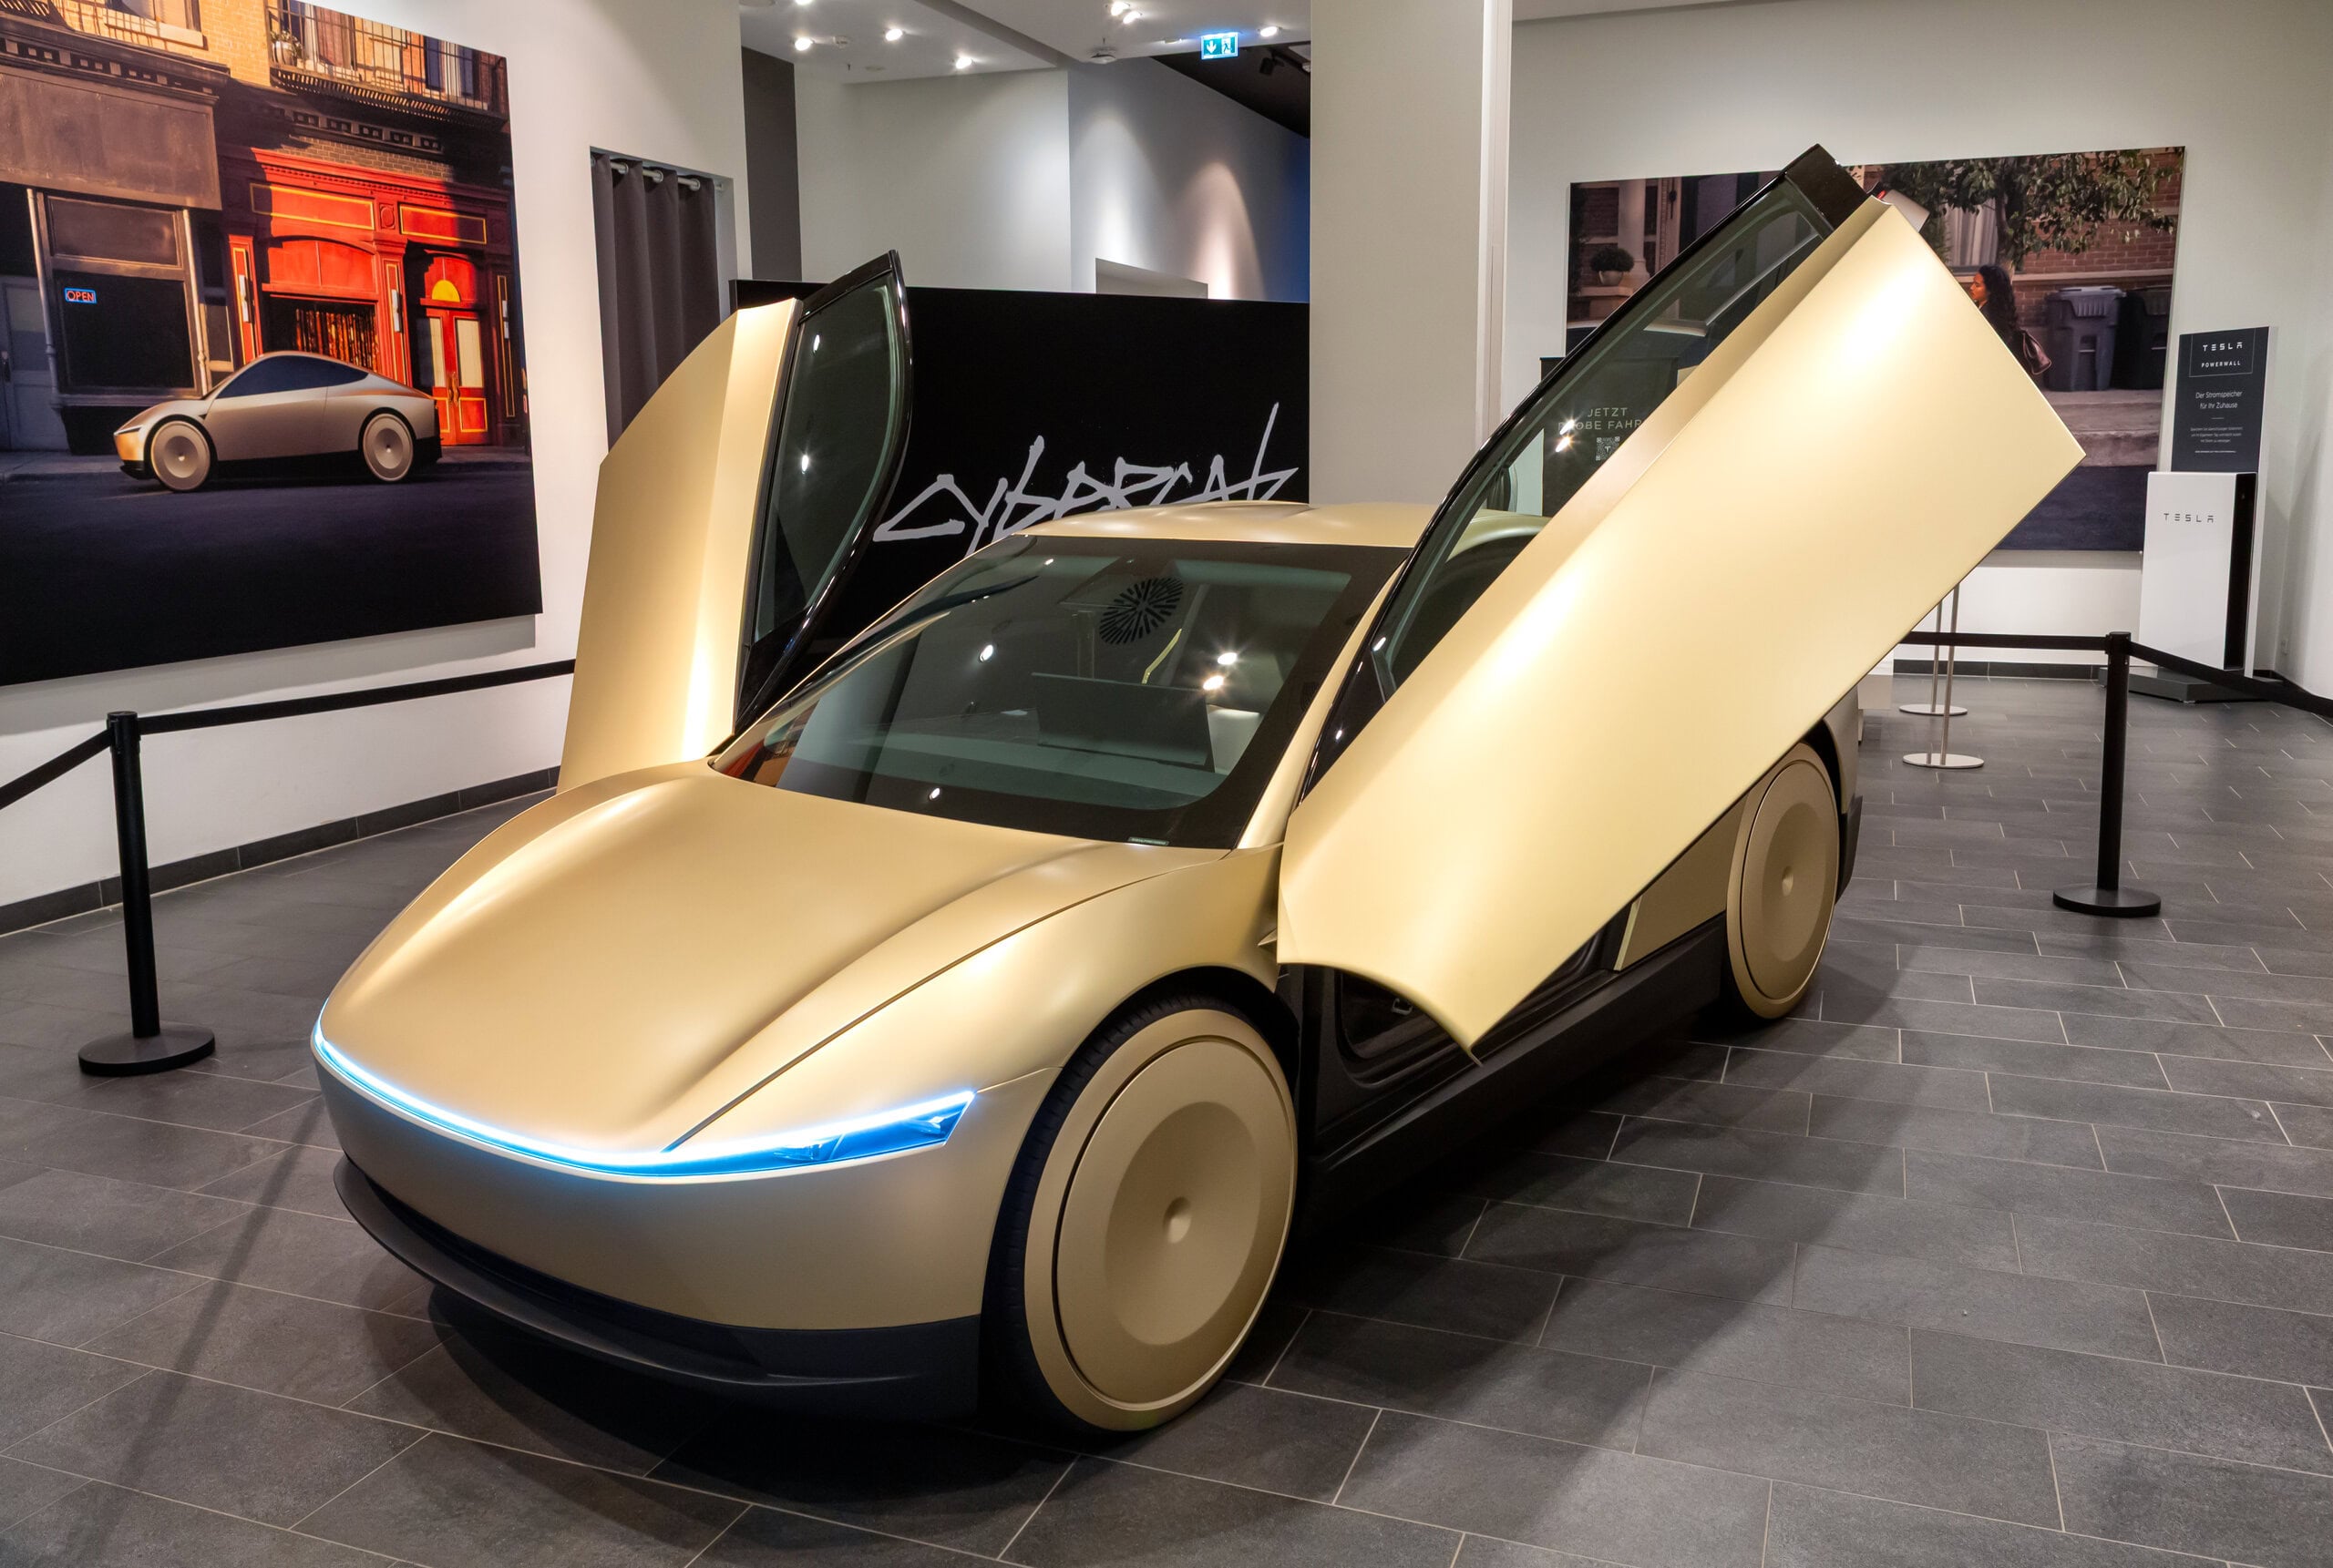
For Tesla, the next meaningful test is regulatory. FSD approval in China and Europe remains pending, and without those markets, the robotaxi model cannot scale as management envisions. Whether Cybercab, Tesla Semi, and Megapack 3 volume production launches on schedule in 2026 is a critical execution test.
For Apple, the watch item is China. Greater China rebounded sharply to $25.53 billion this quarter, but geopolitical friction and tariff exposure remain live risks.
Valuation and Earnings: How the Two Companies Compare Right Now
Apple trades at a trailing P/E of 32x with a market cap of approximately $3.76 trillion. Tesla trades at a trailing P/E of 334x on a market cap of approximately $1.35 trillion. That valuation gap reflects Tesla’s speculative premium on autonomous and robotics potential, not current earnings power.
Apple generated $42 billion in net income this quarter, supported by consistent buybacks and a growing services engine. Tesla’s investment case rests on whether the robotaxi and Optimus narratives materialize on management’s timeline — a scenario that remains unproven while the automotive business continues to shrink.
The two companies represent fundamentally different risk profiles: Apple’s current earnings power versus Tesla’s speculative premium on autonomous and robotics potential.