Apple at 50: What an Investment in the IPO Has Become
Apple (NASDAQ: AAPL | AAPL Price Prediction) went public on December 12, 1980, selling shares at what would become a split-adjusted fraction of a penny. The company that Steve Jobs built around the Apple II was, at the time, a…

This post may contain links from our sponsors and affiliates, and Flywheel Publishing may receive compensation for actions taken through them.

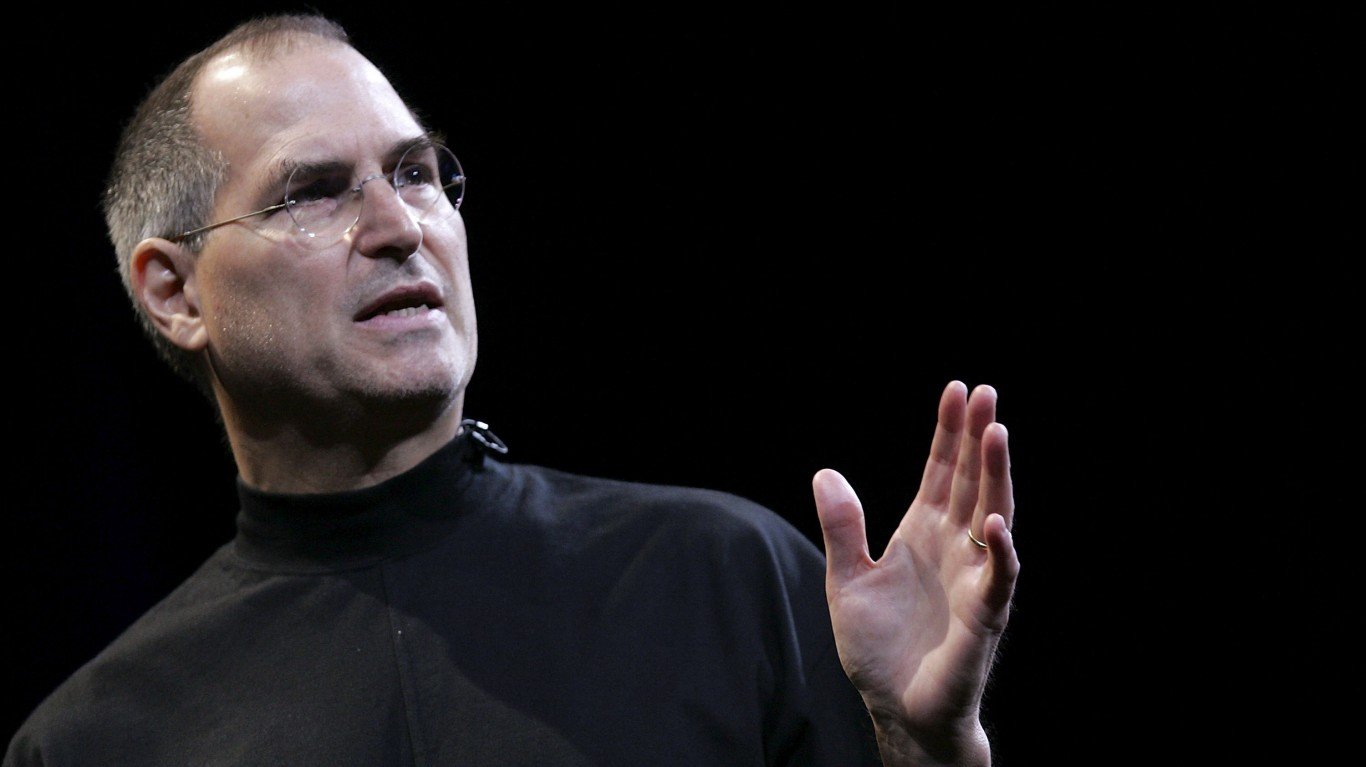
Apple (NASDAQ: AAPL | AAPL Price Prediction) went public on December 12, 1980, selling shares at what would become a split-adjusted fraction of a penny. The company that Steve Jobs built around the Apple II was, at the time, a computer maker competing in a nascent personal computing market. Few investors buying in at the IPO could have imagined what the next four decades would produce.
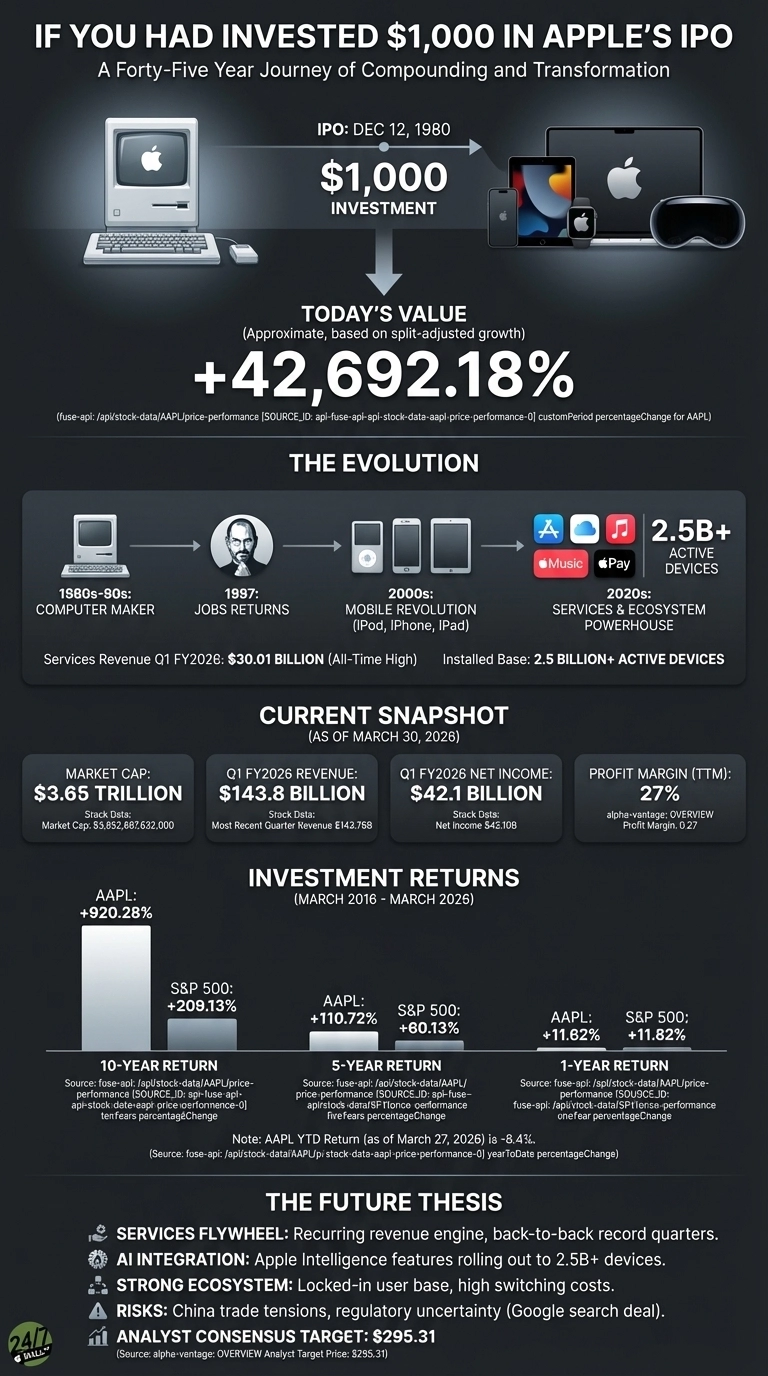
The transformation is the story. Apple nearly went bankrupt in the 1990s before Jobs returned in 1997. The iPod, iPhone, and iPad each redefined consumer technology in succession. Then came the pivot that matters most to investors today: the shift from hardware cycles to a recurring-revenue services engine. Services revenue reached $30.013 billion in Q1 FY2026 alone, an all-time high. The installed base now exceeds 2.5 billion active devices, each one a distribution channel for App Store, iCloud, Apple Music, and Apple Pay.
As Apple approaches its 50th anniversary in 2026, the business looks nothing like the company that debuted on the Nasdaq. Revenue on a trailing 12-month basis stands at $435.6 billion, with a 27% profit margin.
What $1,000 Became Over Every Horizon
1-Year Return (March 2025 to March 2026)
- Initial Investment: $1,000
- Current Value: $1,116.20
- Total Return: 11.62%
- S&P 500 (same period): $1,118.20 (11.82%)
5-Year Return (March 2021 to March 2026)
- Initial Investment: $1,000
- Current Value: $2,107.20
- Total Return: 110.72%
- S&P 500 (same period): $1,601.30 (60.13%)
10-Year Return (March 2016 to March 2026)
- Initial Investment: $1,000
- Current Value: $10,202.80
- Total Return: 920.28%
- S&P 500 (same period): $3,091.30 (209.13%)
Return Since IPO (December 1980 to March 2026)
- Initial Investment: $1,000
- Current Value: $2,533,032
- Total Return: 253,203%
- S&P 500 (same period): $49,741 (4,874%)
The 10-year number likely earns a place in retirement conversations. Apple returned more than triple the S&P 500 over that window, and that excludes dividends. The one-year picture is less flattering: Apple essentially matched the index. The stock is down 8.5% year-to-date as of late March 2026, weighed down by tariff concerns and regulatory uncertainty around its Google search agreement.
Is It Still a Buy?
The Services flywheel continues compounding for investors who believe in the long-term thesis. Services has hit all-time revenue records in back-to-back quarters, and with a forward P/E of 28.9 and analyst consensus targets at $295.31, the market is not pricing in disaster. Apple Intelligence features rolling out across the installed base give the upgrade cycle a new reason to persist.
Key risks include a potential DOJ disruption of the Google search revenue arrangement and further escalation of China trade tensions. Greater China delivered $25.53 billion in Q1 FY2026, up sharply, but that exposure cuts both ways.
The near-term is noisy. The decade-long thesis (a locked-in ecosystem monetizing 2.5 billion devices) remains intact.
Contact [email protected] for any questions or corrections.
Trey has been an editor and author at 24/7 Wall St. for more than a decade, where he has published thousands of articles analyzing corporate earnings, dividend stocks, short interest, insider buying, private equity, and market trends. His comprehensive coverage spans the full spectrum of financial markets, from blue-chip stalwarts to emerging growth companies.
Beyond 24/7 Wall St., Trey has created and edited financial content for Benzinga and AOL's BloggingStocks, contributing additional hundreds of articles to the investment community.
Trey's editorial expertise extends across multiple publishing environments. He served as production editor at Dearborn Financial Publishing and development editor at Kaplan, where he helped shape financial education materials. Earlier in his career, he worked as a writer-producer at SVE. His freelance editing portfolio includes work for prestigious clients such as Sage Publications, Rand McNally, the Institute for Supply Management, the American Library Association, Eggplant Literary Productions, and Spiegel.
Outside of financial journalism, Trey writes fiction and has been an active member of the writing community for years, moderating workshop sessions at regional conventions.