Why 90% of Professional Fund Managers Lose to the S&P 500. Here’s the One Strategy That Works
The most uncomfortable fact in professional money management arrived courtesy of S&P Dow Jones Indices: 90% of active fund managers underperformed the S&P 500 over the last 15 years. These are people paid handsomely to beat a benchmark, and the…


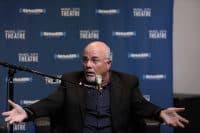
The most uncomfortable fact in professional money management arrived courtesy of S&P Dow Jones Indices: 90% of active fund managers underperformed the S&P 500 over the last 15 years. These are people paid handsomely to beat a benchmark, and the overwhelming majority cannot. On a recent episode of the Money Guy Show titled Everyday Investors Are Beating Fund Managers (Copy Their Strategy), co-host Brian Preston argued that the solution for everyday investors is almost embarrassingly simple.
Why the Pros Lose
Preston and his co-hosts trace the failure to the same behavioral traps that hurt retail investors: herding (being “greedy when others are greedy and fearful when others are fearful”) and overconfidence about predicting near-term market moves. The data on investor psychology backs this up. The University of Michigan Consumer Sentiment Index currently sits at 53.3, a reading the FRED data labels as pessimistic/recessionary. The VIX swung from 13.47 on December 24, 2025 to 31.05 on March 27, 2026 before settling back to 17.87. Anyone trying to outguess those swings was guessing twice: direction and magnitude.
The Great Depression Stress Test
The Money Guy crew uses an extreme historical case to make the point. The Dow Jones Industrial Average closed at 381 on September 3, 1929 and reached just 383 on November 23, 1954, a $2 gain over 25 years. Even in that bleak window, an investor consistently buying through the crash would have accumulated shares at deeply depressed prices and come out ahead of someone trying to time entries and exits.
The Strategy That Actually Works
Preston’s prescription is dollar-cost averaging into low-cost index funds. “If you can set it and forget it and always be buying, that’s what I love about that strategy,” he explained, framing it as a way to “start building wealth the right way, which is slow and steady.”
The math is on his side. The SPDR S&P 500 ETF Trust (NYSEARCA:SPY) carries a net expense ratio of just 0.0945%, returned 262.53% over the past ten years, and is up 26.49% over the trailing twelve months. Investors who want broader exposure can use the Vanguard Total Stock Market ETF (NYSEARCA:VTI), up 249.27% over ten years. Investors can review SPY’s full holdings and fact sheet directly from State Street at the official SPY fact sheet.
What to Watch
With the 10-year Treasury yielding 4.46%, the hurdle rate for active managers has risen. They now have to beat both the index and a meaningful risk-free alternative. The Money Guy’s takeaway is that ignoring both temptations and automating a fixed monthly purchase remains the most reliable way to compound wealth without competing against the 90% who already tried and failed.
Contact [email protected] for any questions or corrections.
I've been writing about stocks and personal finance for 20+ years. I believe all great companies are tech companies in the long run, and I invest accordingly.