A caller named Rambo from San Jose phoned into Mad Money on May 13, 2026 with a question that separates serious investors from tape-watchers. He noted that "although a company looks attractive on a price-to-earnings perspective, it becomes far less attractive on an enterprise value-to-earnings perspective, especially in this high interest rate environment." Jim Cramer’s reply was compressed investing wisdom.
"I look at how much money the company has to pay in interest. I look at how much money they make, and I decide if they don’t make enough money to cover that interest, then it is a sell, sell, sell."
He added a confession that should carry weight given the source: "Every time I violate that principle, I go wrong."
The Interest Coverage Ratio in Plain English
The metric Cramer described is the interest coverage ratio, typically calculated as operating income (EBIT) divided by interest expense. A reading of 5x means operating profit covers annual interest five times over. A reading near 1x means a company runs a treadmill for its lenders. Below 1x means the business cannot service its debt from operations and is leaning on cash reserves, asset sales, or refinancing to stay current.
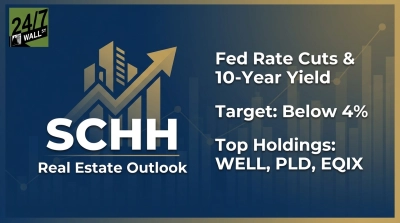
Why it matters now is straightforward. The Fed funds target upper bound sits at 3.75%, and the 10-year Treasury yield closed at 4.59% on May 15, 2026, the top of its 12-month range. The full Treasury curve is positively sloped and elevated, with 2-year yields at 4.07% and 30-year yields at 5.14%. Core PCE remains sticky at the 90.9th percentile of its 12-month range, which is why the Fed has been slow to cut further.
Why Cheap P/E Can Hide an Expensive Balance Sheet
Rambo’s point about EV/EBIT is the heart of the issue. Price-to-earnings looks only at equity holders. Enterprise value adds net debt to market cap, so a company that funded growth with cheap 2021 paper can look like a bargain on P/E while EV/EBIT tells you the lenders own most of the cash flows. When that paper matures into a market where 5-year Treasury yields sit at 4.27% and credit spreads stack on top, refinancing transforms a manageable interest line into an earnings problem.
The macro backdrop reinforces the framework. Corporate profits grew 9.6% year over year in Q4 2025, but gains are uneven. Financial sector profits climbed to $897.1 billion from $742.2 billion a year earlier, while retail profits slipped. The 10Y-2Y yield spread has flattened from 0.74% in February 2026 to 0.54% on May 18, and the VIX, after spiking to 31.05 on March 27, 2026, has settled at 17.82. Calm tape, tight credit math.
What to Watch
Cramer closed with a reminder that screens come after self-knowledge: "Before you start investing, you have to find out what you’re trying to get out of the market, and then you set your goals accordingly." For investors who want a single screening filter this week, interest coverage is the one Cramer himself swears by, and the rate environment makes it no less relevant.
Contact [email protected] for any questions or corrections.