Warren Buffett’s Berkshire Delivered a 39,000x Return Since 1965. He Still Tells Most Investors to Buy Index Funds Instead.
Although Berkshire Hathaway (NYSE:BRK-B) has compiled the single best long-run track record in modern markets, the man who built it spent most of his shareholder letters telling you not to try this at home. On Wall Street, that contradiction has…

This post may contain links from our sponsors and affiliates, and Flywheel Publishing may receive compensation for actions taken through them.
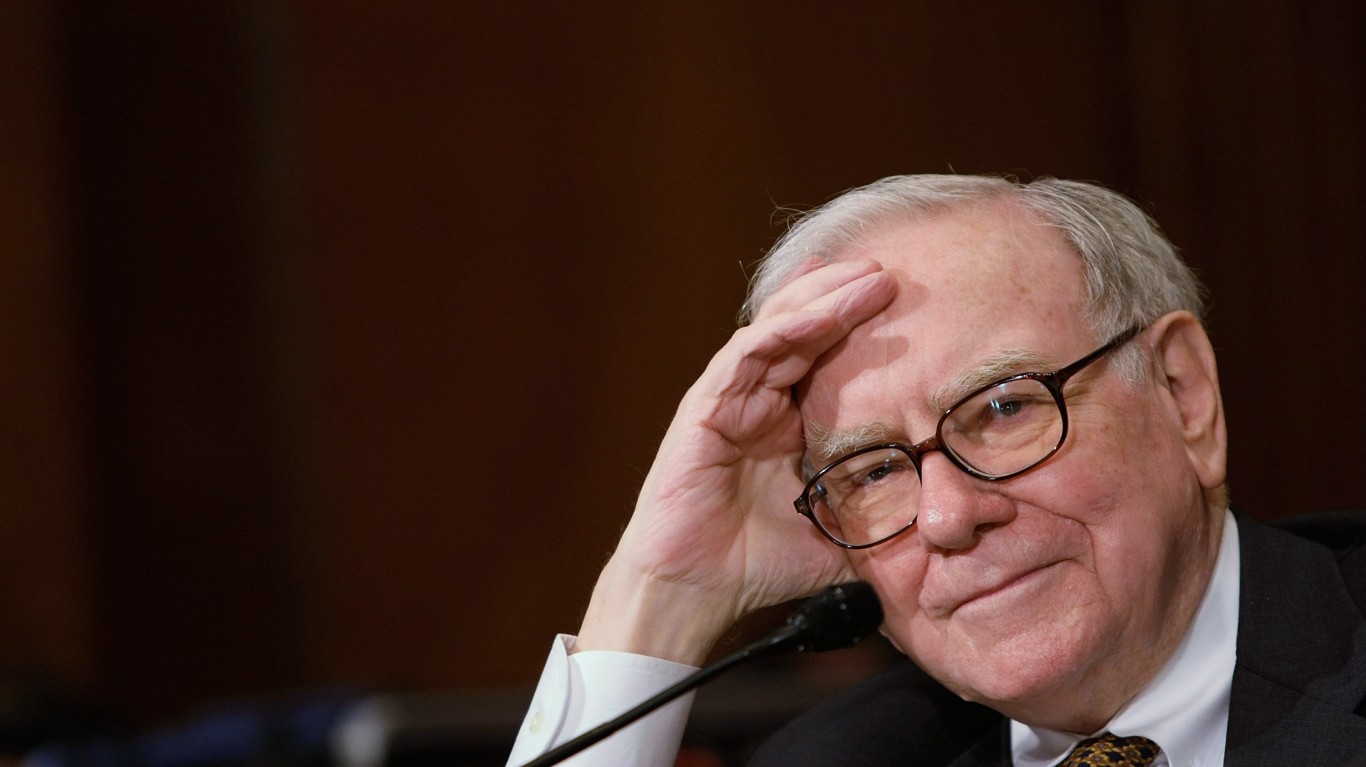
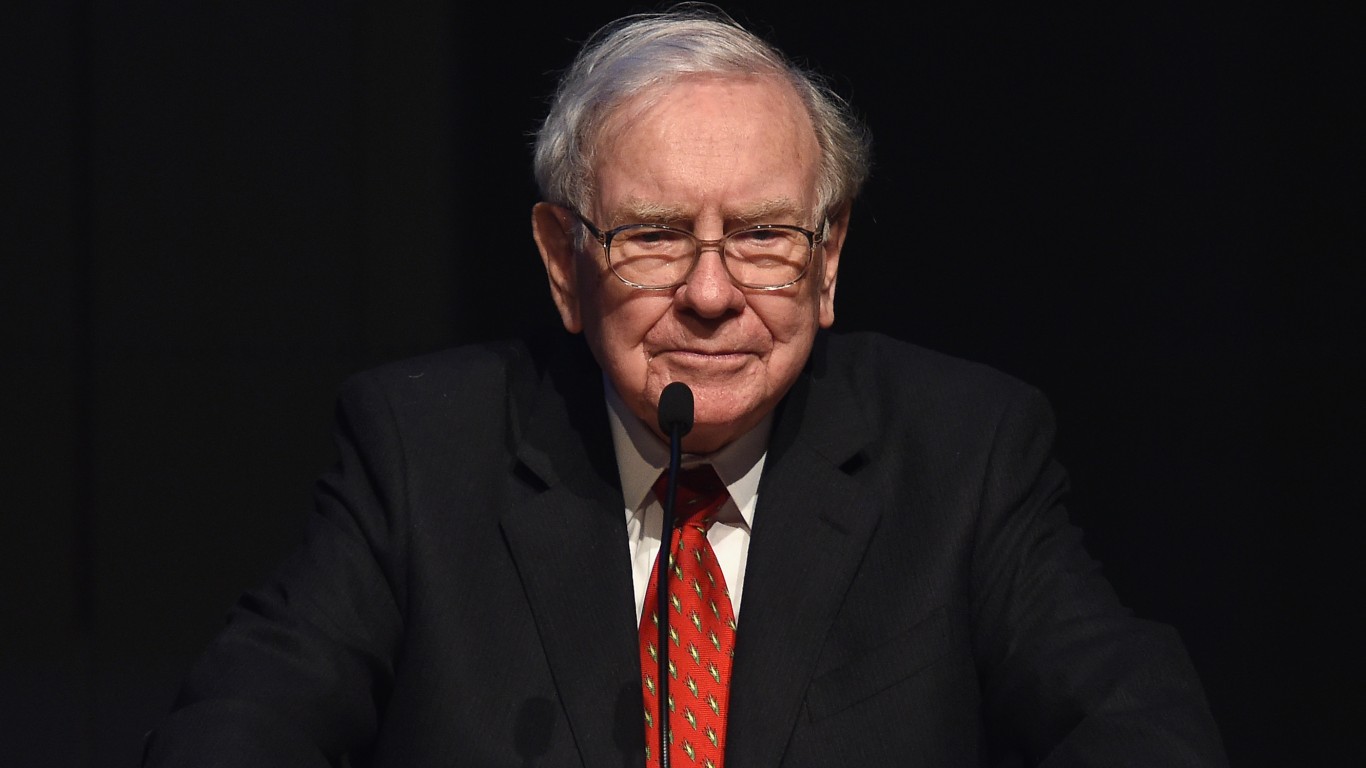
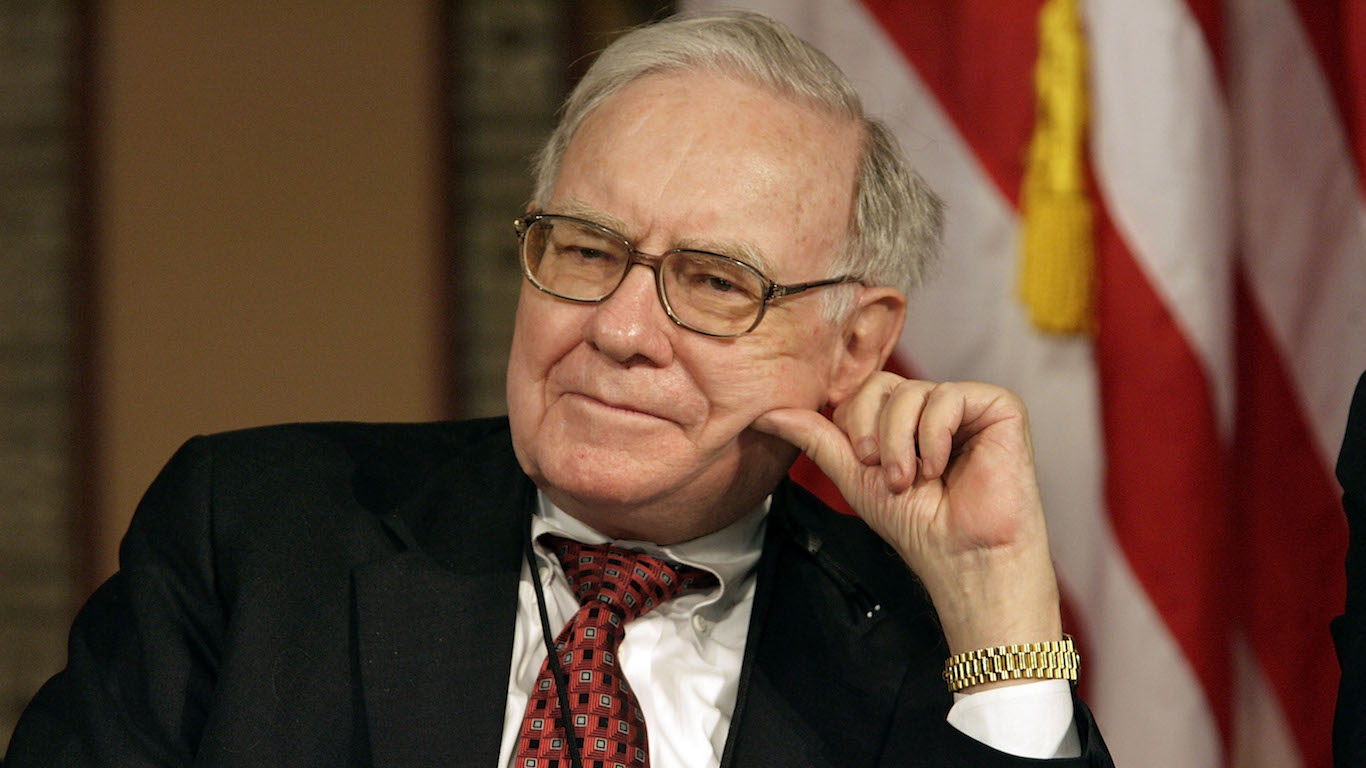
Although Berkshire Hathaway (NYSE:BRK-B | BRK-B Price Prediction) has compiled the single best long-run track record in modern markets, the man who built it spent most of his shareholder letters telling you not to try this at home. On Wall Street, that contradiction has hardened into one of investing’s most durable patterns. From 1965 to 2025, Berkshire posted a 19.7% compound annual growth rate for a 39,000x return. Over that same span, the SPDR S&P 500 ETF (NYSEARCA:SPY), the standard proxy for the benchmark index, compounded at 10.5% a year, translating to a 405x return with dividends reinvested. The man who beat the market by roughly 100 times still says most investors should buy the market.
The Acquired podcast’s Vanguard episode put it well: Berkshire is the extreme exception to a rule that has held for six decades. That rule is backed by hard data. According to S&P Dow Jones Indices’ SPIVA U.S. Year-End 2025 scorecard, 79% of active large-cap U.S. equity fund managers underperformed the S&P 500 in 2025 alone, marking the 16th consecutive year in which the majority of managers in that category lagged the index. Stretch the horizon to 20 years and the failure rate climbs to 93%. The pattern holds because fees compound the wrong way, because turnover taxes returns, and because the median portfolio manager is competing against a diversified, low-cost rival that never sleeps and never asks for a bonus.
Berkshire is the counterexample that proves the rule. The conglomerate wholly owns GEICO, Duracell, Dairy Queen, BNSF, Lubrizol, and Fruit of the Loom, alongside a concentrated equity portfolio whose top five positions as of the Q1 2026 13F filing are Apple (roughly 22% of the portfolio), American Express (roughly 17%), Coca-Cola (roughly 12%), Bank of America (roughly 10%), and Chevron (roughly 7%), per the company’s most recent 13F filings. The B-shares trade at roughly 15 times trailing earnings with a beta of 0.62, meaning the stock moves less than the index it has thrashed over six decades. Over the last ten years Berkshire returned 239% while SPY returned 257%. The recent decade is roughly a tie. The six-decade record is not.
Buffett wrote the line himself in his 1996 shareholder letter: “The best way to own common stocks is through an index fund that charges minimal fees. Those following this path are sure to beat the net results delivered by the great majority of investment professionals.” He repeated the point in 2007 with a $1 million bet against Protege Partners that a Vanguard S&P 500 fund would outpace a basket of hand-picked hedge funds over ten years. The index won. The proceeds went to Girls Inc. of Omaha. He repeated it again in his 2013 letter, instructing the trustee of his wife’s inheritance to put 90% into a very low-cost S&P 500 index fund, with the balance in short-term Treasuries.
Equity ownership in America crept from 4.2% in 1949 to 32% in 1989, to 54% by 2001, to roughly 60% today. The dot-com boom pulled millions of households into brokerage accounts. The 401(k) made participation a default rather than a decision. And the first wave of online brokerages did something subtler but more lasting: they made transparent exactly how much investors were losing to underperforming, high-fee active funds. Once fees were visible, the math did the rest. SPY now carries a net expense ratio of 0.09%, a fraction of what a typical active equity mutual fund charges every year, in good markets and bad.
The transition at Berkshire itself adds a new chapter to the story. Greg Abel became CEO on January 1, 2026, with Buffett remaining as chairman. Abel wasted little time: his first year has already included Berkshire’s $9.7 billion acquisition of OxyChem from Occidental Petroleum and a $6.8 billion purchase of homebuilder Taylor Morrison Home, the latter completed faster and with less involvement from Buffett than most observers expected. Meanwhile, Berkshire’s cash pile neared $400 billion in Q1 2026 as operating earnings rose 17.7% year over year. The patient capital is still working exactly as Buffett designed it to, even under new management.
For the long-term investor, the core verdict remains clear. Berkshire, trading near $488 per B-share, is the most fascinating special situation on Wall Street. The case for owning it rests on whether the operating businesses, the insurance float, and that record cash hoard will keep compounding faster than the index under Abel’s stewardship. The inverse case is equally honest: if you doubt anyone can repeat what Buffett did over 60 years, the index is precisely what Buffett himself recommends.
Honor the pattern, not the exception. The long-term direction of Wall Street still heads higher across the decades ahead, and the cheapest, simplest way to capture that drift is the one Buffett wrote down thirty years ago and never walked back. The man who beat the market by 100 times told you exactly where to put the money you cannot afford to lose chasing the next him.
Editor’s note: This update corrects Berkshire’s 1965-2025 compound annual growth rate from 19% to 19.7%, updates the S&P 500’s matching long-run CAGR to 10.5%, refreshes Berkshire’s top equity portfolio weights to reflect the Q1 2026 13F filing, replaces the “85% of active managers underperform” figure with SPIVA’s 2025 Year-End data (79% in 2025, 93% over 20 years), updates the BRK-B share price, and adds context on Greg Abel’s CEO tenure beginning January 1, 2026, including his first major acquisitions and Berkshire’s record Q1 2026 cash position.
Contact [email protected] for any questions or corrections.
I've been writing about stocks and personal finance for 20+ years. I believe all great companies are tech companies in the long run, and I invest accordingly.