A retiree holding $200,000 of Vanguard High Dividend Yield ETF (NYSEARCA:VYM) collects roughly $4,800 in annual income at the fund’s current distribution yield, with no rebalancing required and no concentration risk to monitor. That quiet pitch sits behind VYM, a roughly $96 billion fund that retirees routinely overlook in favor of louder, higher-yielding products on YouTube. The trade VYM offers is straightforward: a lower headline yield in exchange for spreading income across more than 600 stocks, which is often the right answer for someone who wants set-and-forget income.
What VYM actually owns
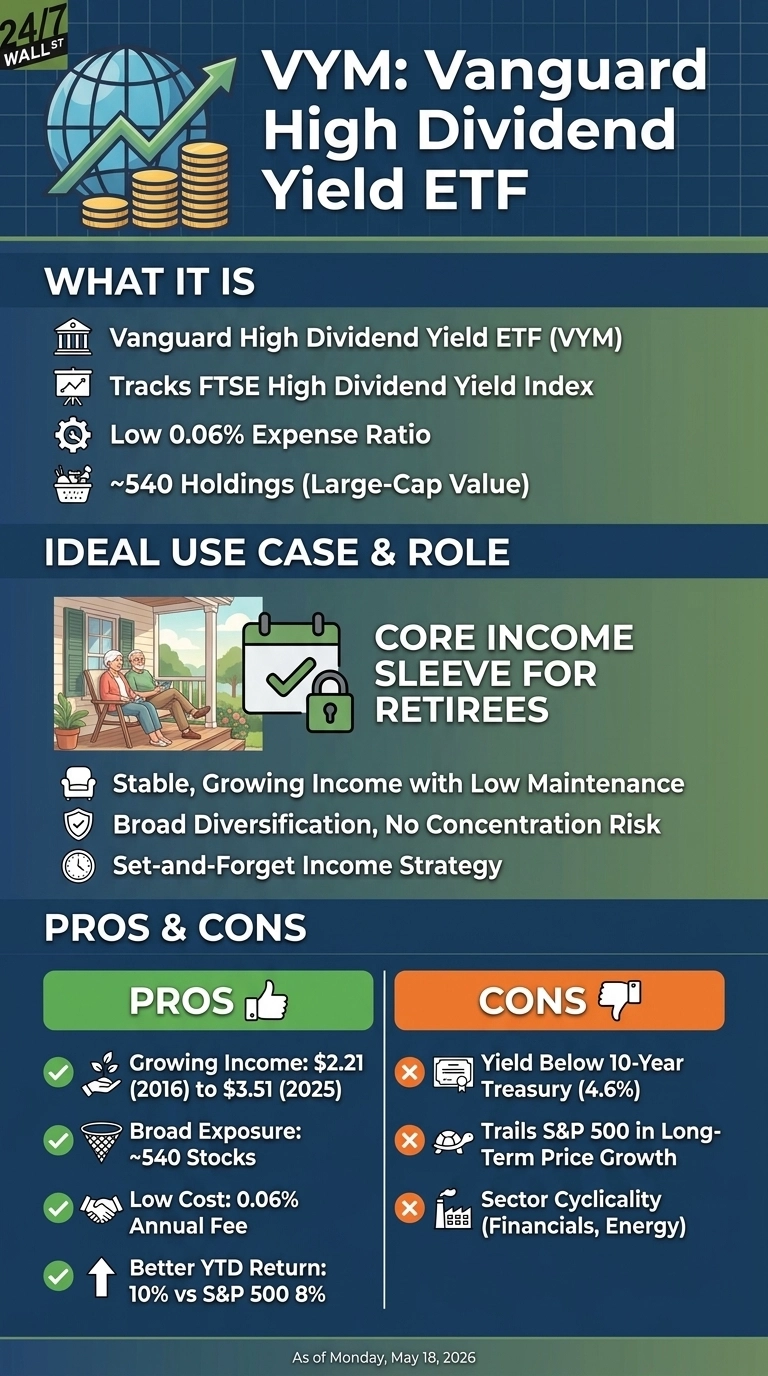
VYM tracks the FTSE High Dividend Yield Index and now charges just 0.04% in annual expenses, down from the 0.06% it carried for years. The top positions are familiar large-cap dividend payers: Broadcom leads the basket at roughly 6% of assets, followed by JPMorgan Chase (NYSE:JPM | JPM Price Prediction), Exxon Mobil, Johnson & Johnson, and Chevron. With more than 610 names in the fund, no single holding dominates, and the return engine runs primarily on qualified dividends from large-cap value companies, with price appreciation as a secondary benefit.
Several of VYM’s core positions have made shareholder-friendly moves recently. JPMorgan plans to raise its quarterly dividend to $1.65 per share for Q3 2026, a 10% increase from its prior $1.50 rate, after clearing the Federal Reserve’s latest stress test. P&G raised its payout again this spring, boosting its quarterly dividend to $1.0885 per share and extending a streak of 70 consecutive annual increases. Johnson & Johnson has maintained its own multi-decade dividend growth streak. This roster of compounders does the heavy lifting without requiring any action from the fund holder.
Does VYM deliver on its promise?
Income is where VYM earns its keep. Annual distributions rose from $2.21 per share in 2016 to $3.51 per share in 2025, reflecting consistent growth across more than a decade of uninterrupted quarterly payments. That expanding coupon profile is something static bond payments simply cannot replicate.
Prospective buyers need to look honestly at the total return picture as well. Over the past decade, VYM posted a 206% total return, while the S&P 500 surged ahead at 325%. Year to date through mid-July 2026, VYM has returned roughly 13%, outpacing the broader market, aided by strength in its technology-adjacent and financial holdings. Over the long arc, VYM trades some growth potential for a steadier, expanding income stream. That swap makes sense for a retiree who needs cash flow today and can accept index-lagging total returns over a full market cycle.
VYM versus the SCHD obsession
The Schwab US Dividend Equity ETF gets most of the YouTube airtime on dividend investing, but its structure is materially more concentrated. SCHD’s top 10 holdings account for roughly 41% of its nearly $98 billion in assets, spread across only about 100 names. VYM spreads its holdings across a far wider basket at the same 0.04% expense ratio. SCHD applies a quality screen and pays a higher yield. VYM trades that headline yield for breadth. For a retiree who wants to stop worrying about any single sector cracking the income plan, the broader approach is the lower-maintenance answer.
The tradeoffs
- Yield below Treasuries. The 10-year Treasury sits near 4.6%, above VYM’s current distribution yield, meaning a pure-income buyer can collect more from government bonds today. The critical difference is that bonds lock in a fixed coupon, while VYM’s distribution has grown every year for a decade.
- Value tilts lag growth rallies. The five-year price gain of 71% trailed the S&P 500’s 80%. VYM’s large-cap value tilt is a structural drag in any environment where mega-cap growth dominates the index, which has been the dominant regime for most of the past decade.
- Sector cyclicality. Financials and energy carry real weight in the portfolio. Broadcom’s rise to the top holding reflects how quickly sector weights can shift as stock prices move, and energy names like Exxon can give back gains just as fast as they accumulate them when oil prices reverse.
Who VYM fits
VYM works as a core income sleeve for retirees who have accepted they are buying yield-plus-modest-growth rather than maximum total return. Accumulators wanting a dividend tilt without the concentration risk of narrower screens can use it the same way. Yield maximizers chasing higher payouts typically turn to covered-call funds instead. For anyone whose plan is to put income on autopilot and stop watching CNBC, VYM may be exactly what they need.
Editor’s note: This update corrects VYM’s expense ratio from 0.06% to 0.04%, reflects the fund’s current AUM of roughly $96 billion and expanded holdings of more than 610 stocks, adds JPMorgan’s planned Q3 2026 dividend increase to $1.65 per share, confirms P&G’s 70-year consecutive dividend increase streak, updates SCHD’s AUM to nearly $98 billion, and refreshes VYM’s year-to-date return to approximately 13% through mid-July 2026.
Contact [email protected] for any questions or corrections.