VYM, SCHD, and SPHD Generate About $6,800 Yearly Income From 755 Stocks With Zero Single-Company Risk
The Vanguard High Dividend Yield ETF (NYSEARCA:VYM) addresses a specific retirement problem: drawing income from stocks without concentrating the outcome in any one company. VYM holds roughly 605 dividend-paying companies, which makes it a natural anchor for a multi-fund income…

The Vanguard High Dividend Yield ETF (NYSEARCA:VYM) addresses a specific retirement problem: drawing income from stocks without concentrating the outcome in any one company. VYM holds roughly 605 dividend-paying companies, making it a natural anchor for a multi-fund income sleeve. Paired with two complementary dividend ETFs, a $200,000 allocation across VYM and its peers produces roughly $6,800 in annual cash flow spread across about 755 underlying positions.
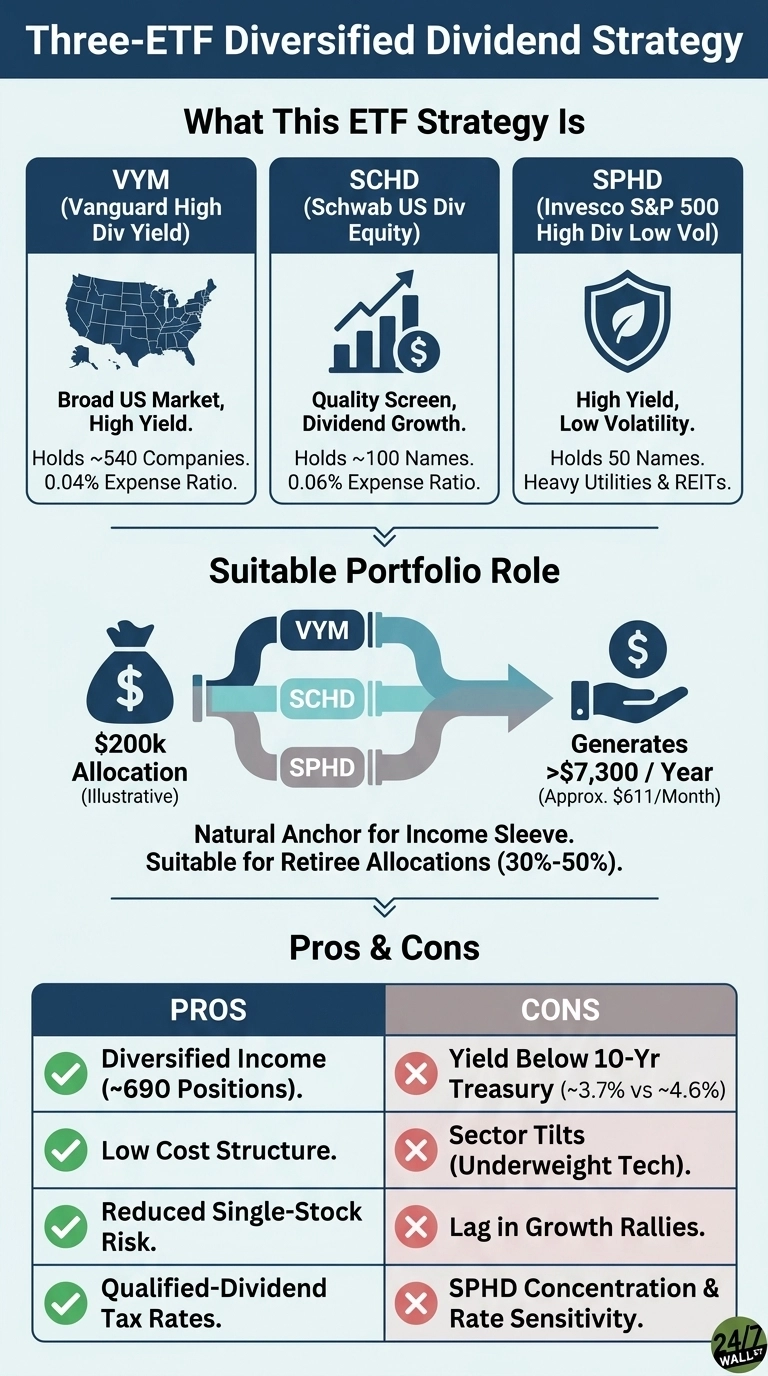
Splitting $200,000 evenly across VYM at a 2.4% yield, Schwab U.S. Dividend Equity ETF (NYSEARCA:SCHD) at 3.2%, and Invesco S&P 500 High Dividend Low Volatility ETF (NYSEARCA:SPHD) at 4.6% generates roughly $1,627, $2,133, and $3,033 in yearly distributions, working out to about $567 a month. The yields on all three funds have shifted since the spring of 2026, pushing the combined income figure down from earlier estimates, though the structural diversification argument is unchanged.
What each fund actually does
VYM screens the domestic equity universe for above-average dividend yields and weights allocations by market capitalization, anchoring broad diversification across financial services, healthcare, and stable consumer names. Its expense ratio stands at 0.04%, ranking among the cheapest vehicles in the equity income space. Total per-share distributions reached $3.6651 in 2025, up from $3.4945 in 2024, a trajectory that reflects steady cash delivery rather than aggressive yield-chasing. Shares now trade near $160, and the fund’s total net assets have grown to roughly $79 billion.
SCHD takes a different approach, running a multi-factor quality screen that measures cash flow to debt, return on equity, baseline dividend yield, and five-year dividend growth before finalizing its roughly 100-stock portfolio. After the March 2026 annual reconstitution, the top positions include Bristol-Myers Squibb at roughly 4.3%, Merck near 4.1%, ConocoPhillips near 4.1%, Lockheed Martin close to 4.1%, and Chevron near 4.0%. AUM has grown to approximately $96 billion. The fund’s 0.06% fee remains among the lowest in the quality-dividend category. Notably, SCHD’s Q1 and Q2 2026 distributions each came in slightly below their year-ago comparables, a detail worth watching given the fund’s reputation for consistent payout growth.
SPHD screens the S&P 500 for the 75 highest-yielding names, keeps the 50 with the lowest trailing realized volatility, and weights by yield. That sequence produces the highest upfront income among the three funds while tilting the portfolio heavily toward utilities, real estate investment trusts, and consumer staples. Monthly distributions climbed from an average of $0.14 in 2024 to $0.21 in mid-2026, a meaningful improvement that income-focused investors have noticed. SPHD is the smallest and most concentrated vehicle in this income basket, and the most sensitive to interest-rate moves.
Does the three-fund mix deliver?
VYM has delivered a one-year total return of roughly 22% with shares trading near $160. SCHD has produced a comparable one-year return of around 26%, making it one of the stronger-performing large-value funds in the category. The combined basket yield of roughly 3.4% sits below the 4.55% available on a 10-year Treasury note, a gap that has narrowed compared to prior years but still exists. A retiree selecting this equity allocation consciously accepts a lower immediate nominal yield in exchange for corporate earnings growth and systematic dividend expansion over time.
The three funds emphasize different factors: yield breadth, quality screens, and low realized volatility. Because of that, overlap is smaller than the shared category label suggests. Across the roughly 605, 100, and 50 holdings, the combined book covers about 755 unique positions, with the largest single-stock weight in the blended portfolio sitting well below the 4% any one name reaches inside SCHD or SPHD alone.
The tradeoffs
- Yield below cash. A blended yield around 3.4% does not clear the current 4.55% 10-year Treasury yield, so part of the case rests on dividend growth and capital appreciation, not income alone.
- Persistent sector tilts. All three funds are underweight technology and overweight financials, healthcare, energy, and staples, which has weighed on relative performance during AI-led rallies.
- SPHD concentration. With only 50 holdings and heavy exposure to utilities and REITs, SPHD is the most rate-sensitive piece of the mix and the most likely to lag in growth-led markets.
- SCHD payout softness. Two consecutive quarters of distributions coming in below year-ago levels introduce uncertainty around the dividend-growth story that has historically attracted capital into the fund.
Who this fits
A retiree using this three-fund combination as a 30% to 50% income sleeve, paired with a broad-market fund like VTI or VOO for growth, ends up with diversified equity income taxed primarily at qualified dividend rates. The basket lags in growth-led markets, and investors expecting capital appreciation matching the S&P 500 will find these funds fall short in those conditions. An equal-weight rebalance once a year prevents any one factor from quietly dominating the income engine.
Editor’s note: This article updates several figures from the original May 2026 publication. VYM’s holding count has risen to roughly 605 stocks (from 540), its expense ratio is confirmed at 0.04% (not 0.06%), and its trailing one-year return has been revised to approximately 22%. SCHD’s AUM has grown to around $96 billion, and its top holdings now include Lockheed Martin and Chevron alongside Bristol-Myers Squibb, Merck, and ConocoPhillips, each near 4% of assets. Current yields for all three funds have shifted, reducing the estimated annual income on a $200,000 equal allocation to roughly $6,800, and the 10-year Treasury benchmark yield is updated to approximately 4.55%. A fourth tradeoff bullet covering SCHD’s two consecutive year-over-year distribution dips in 2026 has been added.
Contact [email protected] for any questions or corrections.
David Beren has been a Flywheel Publishing contributor since 2022. Writing for 24/7 Wall St. since 2023, David loves to write about topics of all shapes and sizes. As a technology expert, David focuses heavily on consumer electronics brands, automobiles, and general technology. He has previously written for LifeWire, formerly About.com. As a part-time freelance writer, David’s “day job” has been working on and leading social media for multiple Fortune 100 brands. David loves the flexibility of this field and its ability to reach customers exactly where they like to spend their time. Additionally, David previously published his own blog, TmoNews.com, which reached 3 million readers in its first year. In addition to freelance and social media work, David loves to spend time with his family and children and relive the glory days of video game consoles by playing any retro game console he can get his hands on.