Trump’s Trading Volume Just Jumped 10x and Topped All of Congress Combined
The Slate Money hosts opened their latest episode with a number that should make every investor sit up. President Trump’s stock trading activity jumped roughly 10x quarter over quarter, rising from around 300 trades in one period to a volume…

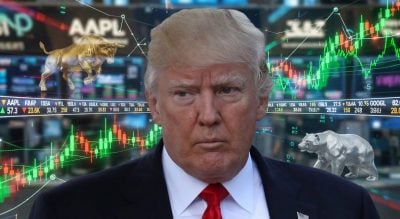
The Slate Money hosts opened their latest episode with a number that should make every investor sit up. President Trump’s stock trading activity jumped roughly 10x quarter over quarter, rising from around 300 trades in one period to a volume that, by dollar amount, exceeded the combined trading of every member of the House and Senate. That is the entire legislative branch, on one side of the scale, and a single executive on the other.
The framing from co-host Emily Peck was direct: “The amount of money he traded in the quarter was more than all the trading by Congress all put together.” For context on what that benchmark actually looks like, congressional trading data shows most individual filings cluster in the $1,001 to $15,000 range, with occasional outliers. The largest recent disclosure in the House dataset was Jefferson Shreve’s $5,000,001 to $25,000,000 annuity exchange filed March 14, 2026, and even Nancy Pelosi’s January 16, 2026 AllianceBernstein partial sale of $1,000,001 to $5,000,000 sat well below what would be needed to rival a presidential book on its own.
The Tax Theory
Co-host Felix Salmon floated the most concrete hypothesis for the surge. “There is a non-zero chance that the thing that changed was that he knew that he wouldn’t have to pay income tax on the gains anymore,” Salmon said. That theory deserves a closer look against the actual 2026 tax code.
Under the One, Big, Beautiful Bill adjustments, the top marginal rate for tax year 2026 remains 37% for single taxpayers with incomes greater than $640,600 ($768,700 for married couples filing jointly). Short-term trading gains are taxed at ordinary income rates, so the friction on rapid in-and-out trading at the highest bracket is meaningful. Salmon’s speculation is that some change in personal tax exposure, real or anticipated, may have unlocked behavior that previously carried a heavy after-tax cost. The hosts framed it as speculation and invited listeners to send in alternative theories.
The Bigger Concern: Market-Moving Comments
The trading volume question sits inside a larger structural issue that Peck highlighted. She referenced a recurring chart from an oil analyst on Twitter showing Trump comments like “we’re getting close to a deal” lining up with immediate drops in oil futures prices. Whether or not the president is trading those exact contracts, the capacity to move asset prices through a single public statement is the asymmetry investors should be modeling.
The legal backdrop matters here. Insider trading remains illegal, but no statute prohibits the president, vice president, or members of Congress from trading individual stocks. The STOCK Act of 2012 requires disclosure within 45 days but does not restrict the trades themselves. That gap has fueled years of proposed reforms targeting congressional trading, none of which have advanced to law.
What Investors Should Take Away
Three practical implications stand out for anyone positioning a portfolio right now.
- Headline risk is structural. When a single public statement can swing oil futures or move equity indexes, hedging exposure around announced trade negotiations becomes a defensive baseline rather than a tactical overlay.
- Disclosure lag is your edge to lose. Congressional filings already carry a one to three week notification delay after transaction dates. Presidential trading disclosures are not centralized in the same way, so the public discovery window can be even wider.
- Volume tells a story. A 10x quarterly increase in trades for any single market participant is the kind of behavioral break that usually precedes either a regulatory response or a strategic shift. Both are worth watching.
Slate Money treated the question as open. The hosts laid out the scale, offered the tax-driven theory as the most plausible candidate they could construct, and acknowledged the rest is speculation pending more data. For investors, the actionable layer is the asymmetry itself.
Contact [email protected] for any questions or corrections.
Joel South covers large-cap stocks, dividend investing, and major market trends, with a focus on earnings analysis, valuation, and turning complex data into actionable insights for investors.
He brings more than 15 years of experience as an investor and financial journalist, including 12 years at The Motley Fool, where he served as an investment analyst, Bureau Chief, and later led the Fool.com investing news desk. He has also co-hosted an investing podcast and appeared across TV and radio discussing market trends.