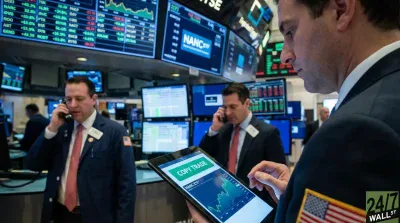
Markets don’t move in a straight line — and neither do the people running the country. Q1 2026 was a quarter defined by tariff headlines, rate uncertainty, and a broad S&P 500 pullback that rattled retail and institutional investors alike. Most people were paralyzed. Some panicked. And at least one person — or rather, one person’s trading desk — was apparently working overtime. Let’s talk about what President Donald Trump’s latest financial statement actually reveals, and what, if anything, investors can take away from it.
3,642 Trades in 63 Trading Days
On May 8, President Trump certified a 113-page OGE Form 278-T filed with the U.S. Office of Government Ethics — the standard financial form for sitting presidents. The number buried inside it is staggering: 3,642 securities transactions executed in the first quarter alone.
That works out to roughly 58 trades per trading day, every single trading day of the quarter.
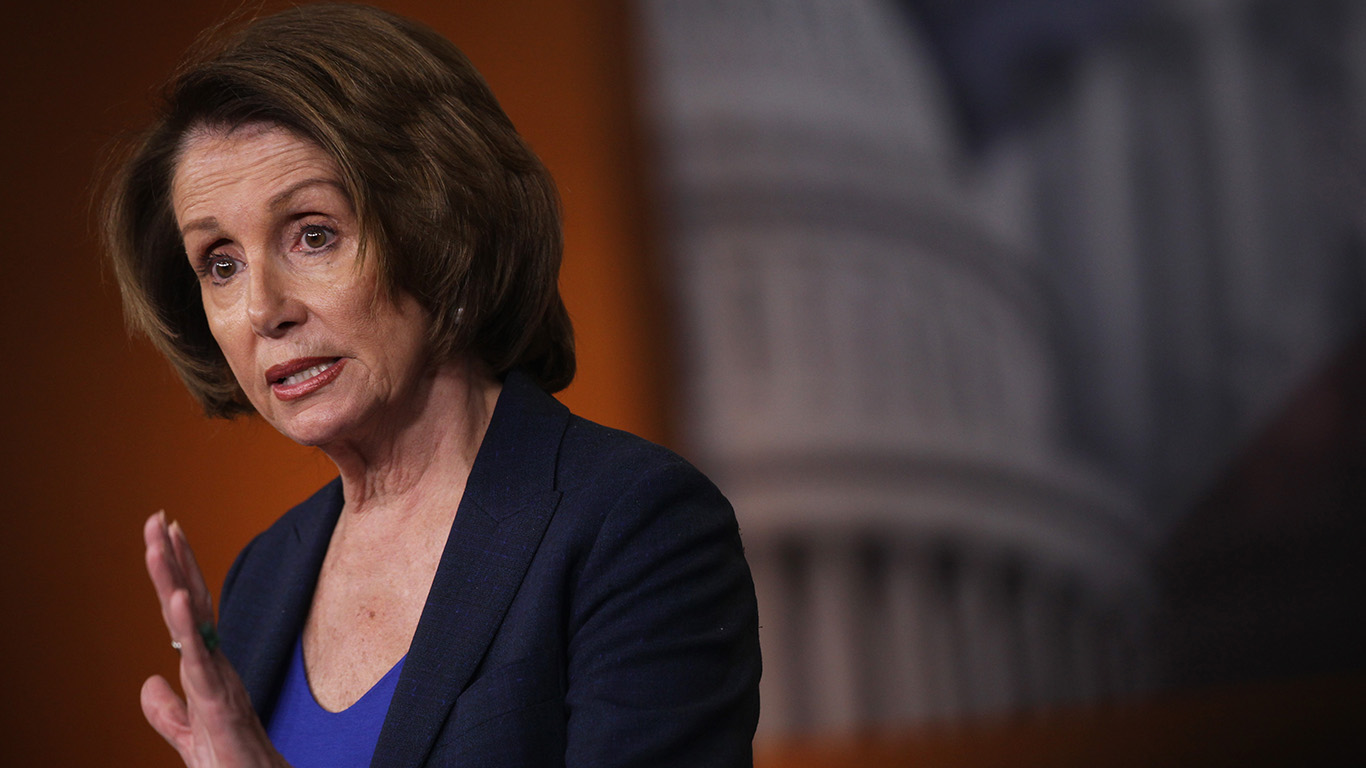
To put that in perspective, most members of Congress — whose trading activity already draws regular scrutiny under the STOCK Act — report a handful of transactions per quarter, typically in the $1,000 to $100,000 range. Former Speaker Nancy Pelosi, often cited as an unusually active congressional trader, logged far fewer trades over comparable periods. Trump’s Q1 pace doesn’t just outpace congressional norms — it laps them.
The filing breaks down into 630 purchases and 3,012 sales. That’s nearly five sells for every one buy — a ratio that tells a specific story about what was happening on the portfolio’s buy side versus its liquidation side.
Big Buys on the Dip, Small Sales Across the Board
Here’s where the data gets interesting for investors. Of the 630 purchases, 36 fell in the $1 million to $5 million range, and another 42 landed between $500,000 and $1 million. The named buys in that top tier include Nvidia (NASDAQ:NVDA | NVDA Price Prediction), Microsoft (NASDAQ:MSFT), Broadcom (NASDAQ:AVGO), Amazon (NASDAQ:AMZN), and Apple (NASDAQ:AAPL) — all of which sold off in Q1 alongside the broader market.
Microsoft purchases alone carried an estimated notional value of $2.4 million to $8.1 million. Amazon buys reached an estimated $2.5 million to $8.3 million. That’s $1 million+ conviction bets placed into a declining market — classic buy-the-dip positioning in the largest, most liquid names in U.S. equities.
The sales side, by contrast, tells a very different story. The 3,012 sales were predominantly small — most fell in the $1,000 to $100,000 range. That’s not portfolio rotation. That’s housekeeping, the kind of incremental pruning that comes when you’re managing a sprawling, multi-hundred-stock portfolio and want to reduce exposure broadly without making concentrated exits.
The total notional value across all 3,642 transactions is estimated at somewhere between $220 million and $730 million, with a central estimate near $475 million. The 278-T format uses ranges rather than exact figures, which is standard — but even at the low end, this is not a casual account.
The Blind Trust Question Every Investor Should Understand
Here’s the context that matters. According to BeInCrypto’s review of the disclosure, most U.S. presidents since Lyndon Johnson have placed personal assets in a blind trust — an arrangement designed specifically to prevent conflicts of interest between a president’s policy decisions and their investment portfolio. Jimmy Carter did it. Ronald Reagan did it. Joe Biden did it. Others simply held U.S. Treasuries.
Trump has not.
That’s not a partisan observation — it’s a structural one that smart investors should understand. When a sitting president retains direct control over a portfolio of individual equities worth hundreds of millions of dollars, every policy announcement, tariff decision, and regulatory shift carries a different kind of weight. The market already prices in presidential policy. It doesn’t typically have to price in the possibility that the policymaker is also a direct beneficiary of specific stock moves.
Granted, correlation isn’t causation, and there’s no evidence in the filing itself of improper trading. But investors should note the framework for what it is: unprecedented in modern presidential history.
Key Takeaway
In short, the OGE Form 278-T reveals a trading pattern that’s impossible to ignore: 3,642 transactions in one quarter, concentrated selling in small lots across hundreds of positions and concentrated buying in mega-cap tech at prices that Q1’s selloff made more attractive.
Savvy investors shouldn’t try to mirror this activity — the scale, speed, and informational context are simply not replicable in a retail account. But the portfolio’s conviction in names like Nvidia, Microsoft, Apple, Amazon, and Broadcom — bought during a market downturn — is at least consistent with where institutional money has historically found its footing after volatility spikes.
Regardless of how you look at it, one thing is clear: whoever manages this portfolio earned their fee in Q1.
Contact [email protected] for any questions or corrections.