The host of Reuters Morning Bid opened the week with a framing that might make investors pause. The current macro environment looks calmer on the surface than the underlying conditions actually warrant, and June is when that gap may close. Two pressures are converging at the same time: energy reserves are depleting due to the Strait of Hormuz blockage, and multiple G7 central banks are lining up to raise rates within weeks of each other.
June as the Crunch Point
The host’s main catalyst pointing to June is the reserves timeline. “Inventories, reserves get burnt away through June, through mid-year, and that starts to change a price hit into potentially a shortage of fuel,” the host said. That transition is the one worth watching. A price shock has a natural ceiling because demand destruction eventually caps the move. A supply shortage is a different animal entirely, and it requires either a resolution of the underlying constraint or genuine rationing.
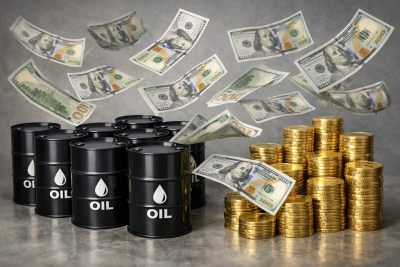
The price data already shows the pressure building. WTI crude closed at $112.25 per barrel on May 18, 2026, up 30.7% over the prior month and sitting at the 98.4th percentile of its 12-month range. That has flowed straight into headline inflation. BEA data shows energy PCE jumped 11.56% month-over-month in March 2026 and 14.43% year-over-year, the most inflationary energy reading in the 36-month dataset. As the host put it, the oil shock “has not hit the real economy in any significant way yet.” The damage so far has shown up in inflation numbers, but the broader economic hit may still be coming.
The Central Bank Convergence
This is where the situation gets genuinely uncomfortable. The ECB is “almost certain, according to the markets at least, to raise interest rates in June,” with the Bank of Japan likely to follow. The host captured the dilemma in one phrase: “Damned if they do, damned if they don’t.”
The logic runs both ways. Raising rates directly pushes short-term borrowing costs higher through the policy rate. Holding rates steady allows inflation expectations to push long-end yields higher on their own, which tightens financial conditions through a different channel. Both paths lead to the same place.
The U.S. Treasury curve is already showing how that second mechanism works. The 30-year yield closed at 5.07% on May 22, 2026, and the 10-year sat at 4.56%, with the 10Y-3M spread widening from 0.71 percentage points on May 1 to 0.88 percentage points on May 22. The long end of the curve is tightening even as the Fed funds rate has held at 3.75% since December 2025.
What the Data Is Saying
Bond markets have been “getting restive for the last week or two,” the host noted, with investors positioning ahead of the Fed’s PCE data release. UK data offered an early preview of what happens when growth gives before inflation cracks: slightly cooler services prices paired with a very poor employment report. Demand destruction is already visible in Asia and has not yet shown up meaningfully in U.S. data.
The American consumer may be closer to the edge than the surface-level calm suggests. The VIX sat at 16.76 on May 21, 2026, well inside the normal range. But University of Michigan Consumer Sentiment fell to 49.8 in April 2026, the lowest reading of the past year and well below the 60 threshold typically associated with recessionary conditions. Those two readings are telling very different stories.
For investors thinking about the next four to six weeks, energy supply constraints, synchronized G7 rate action, and a rising long end of the curve are all pointing at the same mid-year window. Either way, the AI-led equity rally that has dominated recent coverage is running into a competing narrative built on harder data: oil at multi-year highs, core inflation still at 3.2% year-over-year, and consumer sentiment in recessionary territory. A closer look at defensive positioning may be worth the time.
Contact [email protected] for any questions or corrections.