A dollar put into Columbia EM Core ex-China ETF (NYSEARCA:XCEM) on the last trading day of 2025 was worth about $1.38 by the close on June 3, 2026. The same dollar in SPDR S&P 500 ETF (NYSEARCA:SPY) was worth about $1.11. That is XCEM up roughly 38% year to date against SPY up about 11%, a gap wide enough that a $50,000 allocation to XCEM at the start of the year is now worth roughly $19,000 more than the same allocation parked in the S&P 500. And almost nobody on Reddit is talking about it.
The Arithmetic, Without the Cheerleading
XCEM started 2026 at a split-adjusted $38.36 and closed June 3 at $53.06. SPY went from $681.92 to $754.24. These are price-only numbers using adjusted closes, which for XCEM means dividends and any capital gains distributions are folded in. The one-year picture is even more stretched. XCEM is up roughly 71% over the trailing twelve months. SPY is up about 27%.
Step back to five years and the picture changes. XCEM is up roughly 76%, SPY is up about 78%. Most of XCEM’s lifetime alpha has been delivered in the last twelve months. That single fact is the article. This is a regime trade that finally caught a regime, rather than slow, durable compounding.
What Actually Did the Work
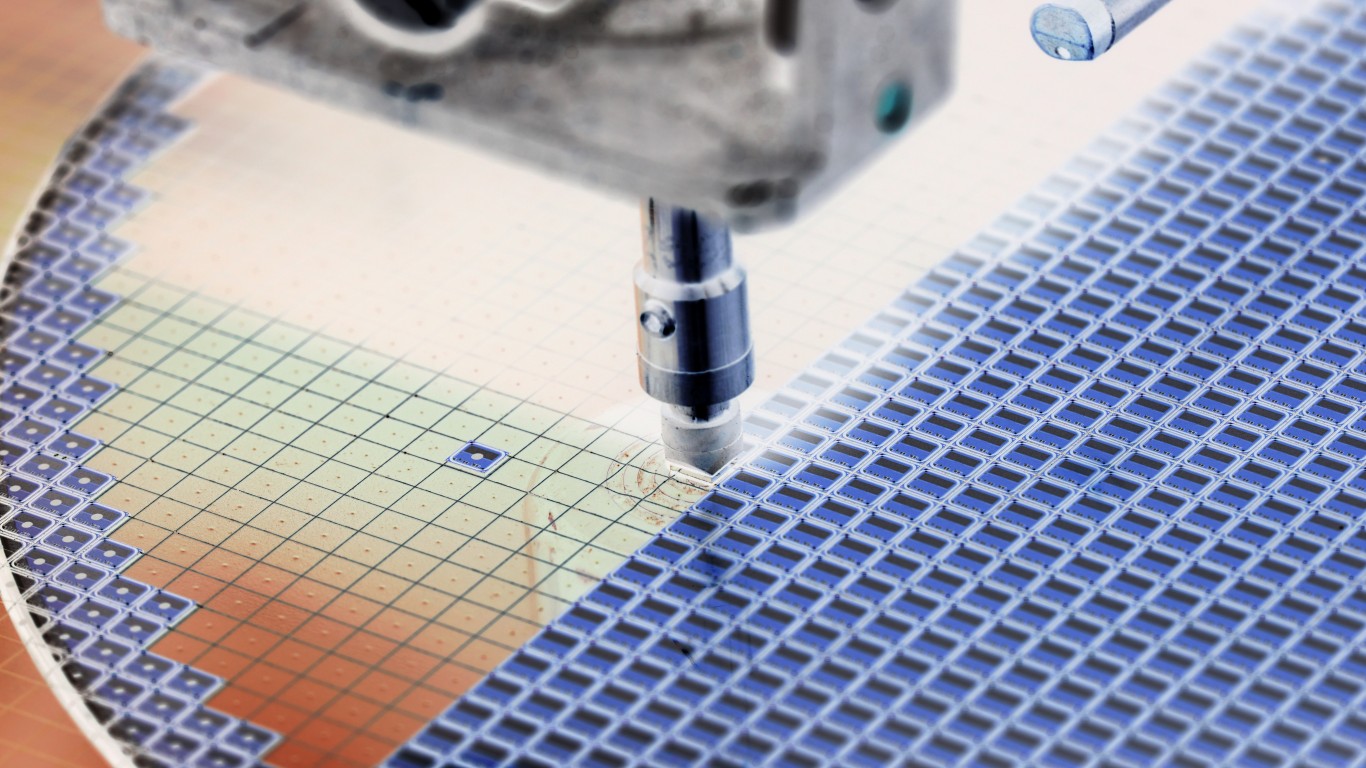
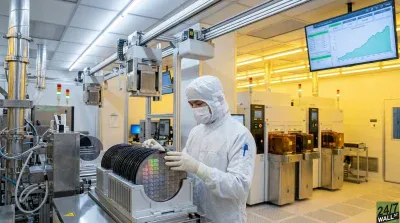
XCEM tracks the Beta Thematic Emerging Markets ex-China index, which means the fund owns the EM growth complex you actually wanted exposure to (Taiwan, South Korea, India) without the policy-risk anchor of mainland China and Hong Kong equities dragging on returns. As of February 2026 reporting, the fund’s largest country weights sit in India, South Korea, and Taiwan, with Taiwan Semiconductor Manufacturing among its top single-name positions.
Three things converged in the first five months of 2026, and you can name all of them.
First, the AI capex cycle that pulled NVIDIA (NASDAQ:NVDA | NVDA Price Prediction) to a 7.58% weight in SPY also pulled the companies that actually build the chips and the memory. TSMC and the Korean memory complex (Samsung Electronics, SK Hynix) are the manufacturing tier under the US hyperscaler order book, and XCEM has sat directly on top of that exposure. 24/7 Wall St. attributed the fund’s outperformance to "its heavy exposure to South Korean semiconductor companies benefiting from the AI boom and its investments in India’s financial sector."
Second, the dollar. JP Morgan’s 2026 outlook flagged that "a weaker U.S. dollar has contributed another 7%pts" to international equity returns and that the dollar remained roughly 10% overvalued versus fair value entering the year. Morningstar’s 2026 view called the greenback’s move "a more prolonged phase of cyclical weakness" rather than a secular break. For a US-based holder of EM equities, a softer dollar is a tailwind layered on top of the local market move, and that is mechanically half of why XCEM’s print looks the way it does.
Third, what XCEM does not own. Funds that include China have spent 2026 absorbing the on-again, off-again stimulus debate and the kind of headline risk you saw in the "The ‘Beijing Miracle’ is Pure Copium" thread that drove SPY’s bearish sentiment spike on May 14. XCEM sidesteps all of it by construction. That is the entire pitch, and in 2026 the pitch finally paid.
The Quiet Part
Quiet is the right word. SPY Reddit chatter has been loud in both directions, swinging from a sentiment reading of 92 (very bullish) on May 17 to 16 (very bearish) on May 14, with one stocks thread ("The S&P 500 is trading at 31.8x earnings. What exactly is the bull case from here?") pulling 538 comments. XCEM, meanwhile, generated essentially no retail conversation in the same window. Institutional flow tells a different story. Commonwealth Equity Services lifted its XCEM stake by 26.6% in the third quarter to 723,252 shares worth about $26.28 million, with several other firms initiating or adding positions. This is the kind of breakout that shows up in 13F filings before it shows up in group chats.
The Cost Angle Most People Miss
XCEM is also the lower-cost choice in its niche. Its expense ratio sits at roughly 0.16%, materially below the more widely owned iShares MSCI Emerging Markets ex China ETF (EMXC). For a fund category where one-year performance dispersion among ex-China products is tight, fee drag is the easiest edge to harvest, and XCEM has been quietly harvesting it. SPY at 0.0945% remains cheaper in absolute terms, but the comparison that matters is XCEM versus its EM ex-China peers, and on that comparison XCEM wins on price.
What Has to Hold for a Repeat, and What Probably Will Not
Here is where the honest part of the article lives. The setup that produced a roughly 38% first five months requires three things to keep going, and you can watch all three from a brokerage screen.
The dollar has to keep weakening or at least not snap back. The DXY level matters more than any single XCEM data point. If the Fed turns less dovish than markets expect, or if a risk-off episode bids the dollar as a safe haven, the currency tailwind reverses fast. BlackRock’s 2026 framing called the broader rally "a relatively boring, low-volatility rally" built on a fragile equilibrium that includes US dollar weakness and Fed dovishness. Both can change in a single CPI print.
The AI capex cycle has to keep funneling orders to Taiwan and Korea. The leading indicators here are TSMC’s revenue guidance and Samsung/SK Hynix HBM commentary, rather than anything XCEM itself publishes. If hyperscaler capex guidance flattens in the second half of 2026, the upstream manufacturers feel it before the US-listed AI names do, and XCEM is mostly upstream manufacturers.
India has to keep delivering earnings. Goldman Sachs flagged "strong GDP growth" driving "steady corporate earnings," with a population where 65% sits below 35 years of age. That demographic story is real and durable. Indian equity valuations, however, have already moved a long way, and XCEM’s India sleeve is no longer cheap.
The single risk that matters most is the one 24/7 Wall St. flagged in February, that XCEM’s "concentration in semiconductors and potential for underperformance if China’s markets rebound are notable tradeoffs." A genuine China reflation, whether from stimulus actually working or from a tariff thaw, would pull global EM money back toward the index XCEM was built to avoid. That is the regime change that would close the gap fastest.
The takeaway is narrower than the headline number suggests. XCEM did not discover a structural edge in 2026. It owned the right countries at the moment the dollar weakened and the AI order book stayed full, and it skipped the one country where the policy overhang stayed heavy. If the dollar firms or hyperscaler capex guides lower, the same construction that delivered roughly 38% in five months will deliver a much more ordinary number in the next five. Watch DXY and the TSMC monthly revenue release. Those are the two indicators that will tell you whether the quiet breakout keeps running or whether the catch-up trade against SPY is mostly already in the price.
Contact [email protected] for any questions or corrections.