A $10,000 position in Fidelity MSCI Information Technology Index ETF (NYSEARCA:FTEC) on the last trading day of 2025 was worth about $12,480 by the close on June 8, 2026, a gain that arrived in roughly five months while the broad market did something far more modest. The same $10,000 parked in Vanguard S&P 500 ETF (NYSEARCA:VOO) over the identical window would be worth about $10,870. That is the story in one paragraph. A single-sector tilt fund, cheaper than most mutual funds your parents owned, lapped the most popular index ETF in the country by a wide margin in less than half a year.
The arithmetic, with the headline trimmed honestly
FTEC opened the year at $224 and closed June 8, 2026 near $280, a year-to-date total return of 24.8%. Round it up if you like, but the cleanest number on the page is the comparison: VOO returned about 9% over the same stretch, and SPY, the older cousin tracking the same index, returned 8.4%. Call it a gap of roughly 16 percentage points in five months and change. Extend the window and the picture deepens. Over one year FTEC is up about 51% against VOO at about 25%. Over ten years FTEC is up roughly 826% versus SPY at roughly 252%. That is a decade of the same trade working.
And it costs nothing to own. FTEC’s expense ratio is 8.4 basis points, which is to say, about $8 a year on a $10,000 position. You pay more for one large coffee.
What actually did the work
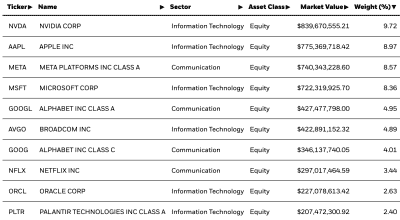
Two names. That is most of the answer. As of March 24, 2026, NVIDIA was about 18% of FTEC, Apple about 15%, and Microsoft about 12%, putting the top three holdings near 45% of the fund. When you own FTEC you are, in practice, buying a basket where almost half of every dollar tracks three companies, and two of them have been on a run that explains the entire spread over VOO.
NVIDIA (NASDAQ:NVDA | NVDA Price Prediction) reported its fiscal Q1 2027 in May and the numbers are still hard to process. Revenue hit $81.6 billion, up 85.2% year over year, with Data Center alone contributing $75.2 billion. Data Center Networking revenue tripled year over year, up 199%. Non-GAAP gross margin held at 75% at a scale where margins usually buckle. CEO Jensen Huang described the moment as "the largest infrastructure expansion in human history", and the company guided next quarter to $91 billion in revenue. That is a quarterly number, not annual. NVIDIA is up about 47% over the past year, and given its weight inside FTEC, every dollar of that move shows up in the ETF.
Apple (NASDAQ:AAPL) delivered more than the boring leg it was expected to be. March-quarter revenue of $111.2 billion was up 16.6% year over year, iPhone revenue jumped to $56.99 billion from $46.84 billion, and Services hit an all-time record of $30.98 billion. Tim Cook attributed it to "extraordinary demand for the iPhone 17 lineup". Apple followed that up with a 4% dividend hike and a $100 billion buyback authorization. The stock is up about 48% over twelve months. Two of the three largest holdings in FTEC produced roughly 47% to 48% one-year returns. The S&P 500’s tech-light cousins did not.
The mechanism, in one sentence
FTEC is a cap-weighted information-technology index fund concentrated in the exact companies sitting at the choke point of AI infrastructure spending, in a year when that spending accelerated rather than peaked. Hyperscaler capex bought GPUs from NVIDIA. Consumers bought iPhones. The two trades happened to live inside the same wrapper, and you paid 8.4 basis points for the privilege.
What has to hold for this to keep working
The honest read is that the conditions remain in place but the math has gotten less generous. NVIDIA guided next quarter to $91 billion in revenue with $119 billion in supply-related commitments backing the order book. Hyperscaler capex plans for 2026 have, if anything, been revised higher. JP Morgan’s own 2026 outlook flagged that consensus 2026 EPS growth for the Magnificent 7 has been revised up to 20.3%, against 13.7% for the broader S&P 500. That earnings gap is the entire reason a sector-tilt ETF beats a market-cap-weighted one.
The wobble worth watching is at the demand side. GPU rental prices declined through the second half of May, with H200 rates down 38%, the kind of data point that suggests supply is finally catching demand at the margin. Vanguard’s house view is more direct, warning that heady expectations for U.S. technology stocks are unlikely to be met over a five-to-ten-year window, both because earnings expectations are already high and because new entrants tend to erode aggregate profitability. FTEC over the past week is down about 6%, NVIDIA down 6.9%, and the Reddit cohort that piles into these names has noticed.
The forward read, then. FTEC is not a one-off. The ten-year record makes that clear, and the mechanism (cap-weighted exposure to AI infrastructure leaders at a near-zero fee) is structural rather than lucky. What changes is the entry price. You are buying NVIDIA at a $5 trillion market cap and Apple at a rich earnings multiple, not the prices that produced the ten-year chart. If hyperscaler capex guidance holds and gross margins stay near 75%, the tilt keeps paying. If either cracks (watch quarterly capex commentary from the three largest cloud buyers, and watch NVIDIA’s gross margin line in the next two earnings reports), the same concentration that drove the outperformance turns the other direction faster than VOO ever would. The fund is doing exactly what it says on the tin. The tin is just heavier than it used to be.
Contact [email protected] for any questions or corrections.