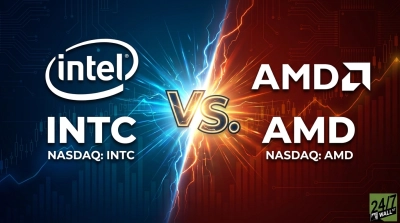
Intel (NASDAQ: INTC | INTC Price Prediction) and Qualcomm (NASDAQ: QCOM) both just delivered earnings that tell very different stories about how to win in AI silicon. Intel posted a sixth straight revenue beat while absorbing a $4.07 billion Mobileye charge. Qualcomm landed its fourth consecutive EPS beat with handset weakness offset by record auto.
Foundry Momentum Carries Intel. Cars Carry Qualcomm.
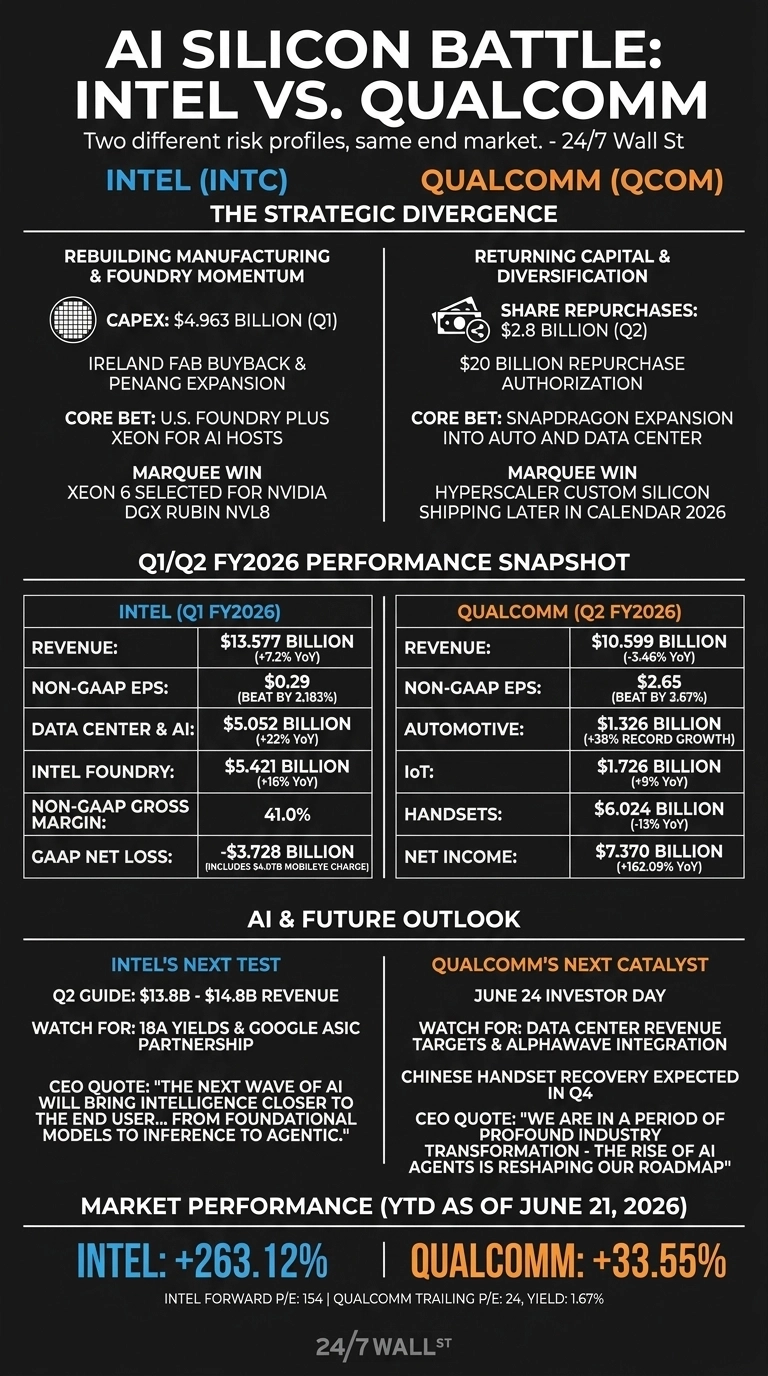
Intel’s Q1 FY2026 earnings report showed $13.577 billion in revenue, up 7.2% year over year, with Data Center and AI climbing 22% to $5.052 billion and Intel Foundry up 16%.
CEO Lip-Bu Tan framed the moment plainly: “The next wave of AI will bring intelligence closer to the end user, moving from foundational models to inference to agentic.” Non-GAAP gross margin expanded to 41%, a real signal that the 18A ramp is paying off.

Qualcomm’s quarter looked steadier and stranger. Revenue of $10.599 billion slipped 3.46% year over year. Handsets fell 13% to $6.024 billion on memory constraints and weak Chinese OEM demand.
Automotive ripped 38% higher to a record $1.326 billion, and IoT added 9%. Cristiano Amon told investors Qualcomm is now “in a period of profound industry transformation” tied to AI agents.

One Rebuilds Manufacturing. One Buys Back Stock.
The strategic split is the whole story. Intel is pouring capital into wafers, with $4.963 billion in Q1 capex, an Ireland fab buyback, and a fresh Penang expansion.
Qualcomm is doing the opposite, returning cash aggressively. Management authorized a $20 billion repurchase and bought back $2.8 billion in shares last quarter alone.
| Lens | Intel | Qualcomm |
| Core Bet | U.S. foundry plus Xeon for AI hosts | Snapdragon expansion into auto and data center |
| Marquee Win | Xeon 6 selected for NVIDIA DGX Rubin NVL8 | Hyperscaler custom silicon shipping in 2026 |
| Key Vulnerability | GAAP losses, capex risk if 14A demand slips | Handset concentration, Apple vertical integration |
Intel’s forward P/E of 154 reflects an earnings recovery the market is willing to underwrite. Qualcomm trades at a far more grounded 24 trailing P/E with a 1.67% yield. Two different risk profiles, same end market.
The Next Test Is Whether Diversification Sticks
I will be watching Intel’s Q2 guide of $13.8 billion to $14.8 billion and whether 18A yields hold as volume scales. The Google ASIC partnership and the reported Apple production tie-up could reshape the foundry narrative if either delivers signed wafer commitments.
For Qualcomm, the June 24 Investor Day is the catalyst. The key items to watch are hard data center revenue targets and any color on the Alphawave integration. The Chinese handset trough is expected to bottom in Q3 and recover in Q4, so any slip there changes the math fast.
Why I Lean Toward Qualcomm If I Had to Choose Today
Intel’s chart has been remarkable. The stock is up 263.12% year to date and 100.64% since the April earnings release. That run already prices in a lot of foundry success that has yet to show up in GAAP profit.
For me, Qualcomm’s mix of record auto growth, a real dividend, and a credible data center entry feels easier to underwrite. Intel offers turnaround torque for investors who can tolerate restructuring noise, while one more clean quarter would further validate the thesis.
Contact [email protected] for any questions or corrections.