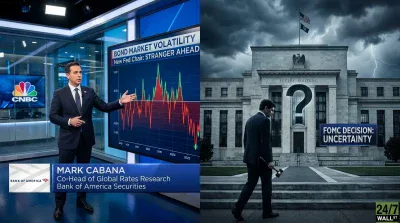
Torsten Slok, the Apollo Global Management (NYSE:APO | APO Price Prediction) chief economist who has spent the past year warning that the Fed would have less room to cut than markets wanted, went on CNBC last week and essentially argued that his own thesis had just been overturned by a barrel of oil.
The Federal Open Market Committee had delivered a hawkish dot plot the day before, and within 24 hours the inflation backdrop underneath those dots had moved sharply in the other direction. The speed of the reversal is what makes this moment unusual: a single FOMC cycle now contains both a hawkish signal and the commodity move that could neutralize it.
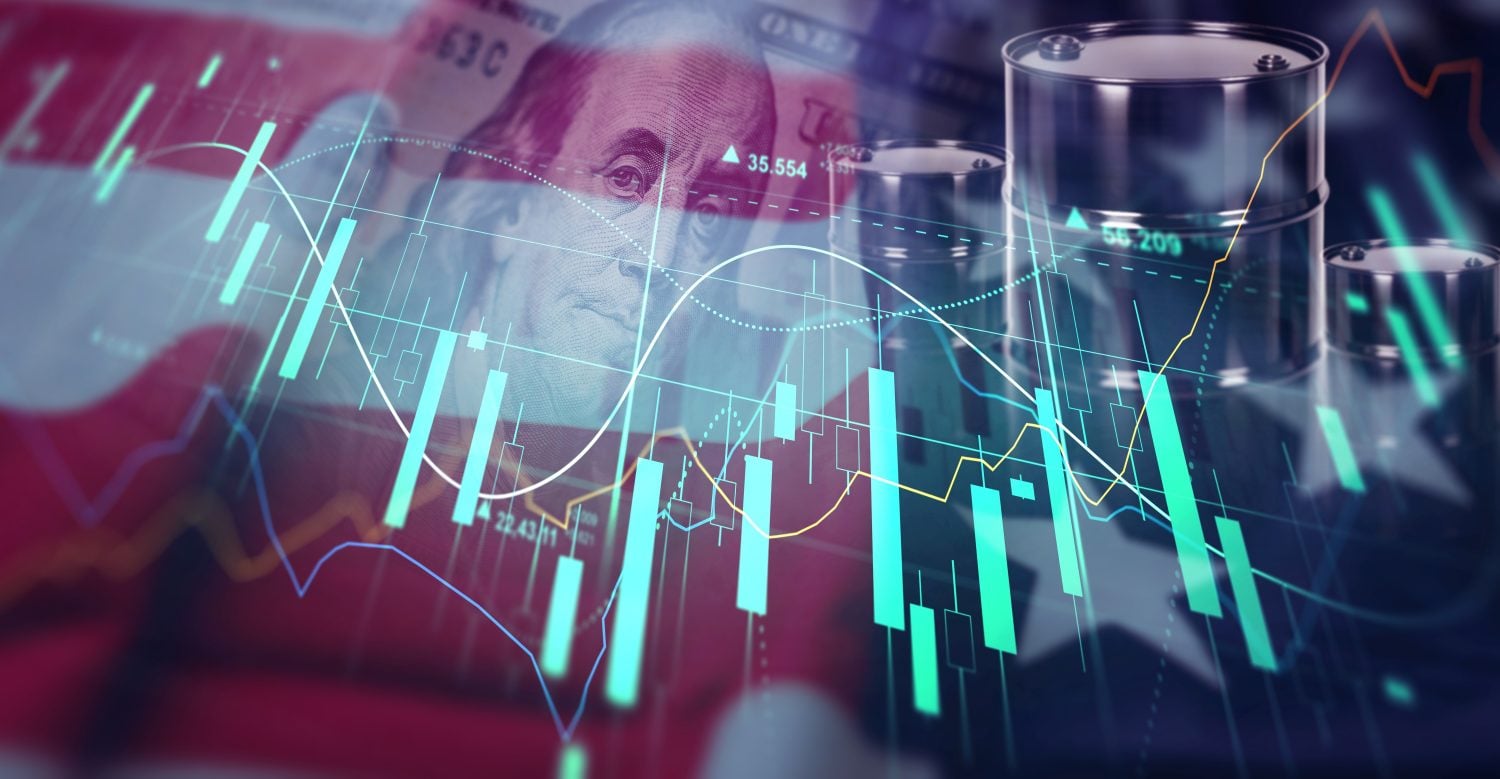
Oil’s two-month round trip from $120 to the high seventies
WTI crude peaked at $114.58 per barrel on April 7, 2026 and is now near $73. Slok rounded the move to a cleaner frame, telling viewers “it’s only two months ago when oil prices were $120 a barrel and now we’re below 80… that indeed has some very significant implications for the inflation forecast.” The pass-through is already visible at the pump.
The national average for regular gasoline is now below $4, down from a $4.5 peak on May 11. Households watch gas prices the way traders watch the VIX, so a 10% monthly drop matters more for sentiment than its CPI weight suggests, even if University of Michigan sentiment is still mired at 49.8, a level the survey treats as recessionary. Energy is also one of the few CPI components that flows through to headline inflation within weeks rather than quarters, which is why Slok keeps coming back to it when other forecasters focus on shelter and services.
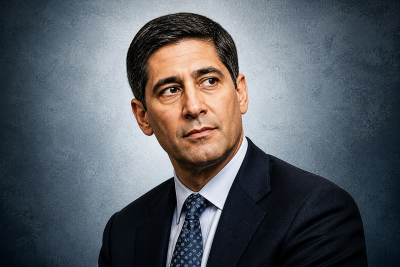
Why Kevin Warsh refused to lock in a path
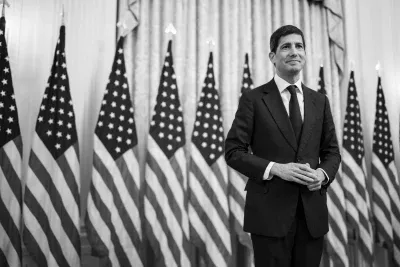
Warsh, in his first FOMC as Fed Chair, declined to submit a dot and declined to deliver the usual forward guidance. Slok treated this as a deliberate design choice. “Kevin Warsh wants to take a very honest and clear look at a number of different areas of policy… we will get from the task forces by the end of the year very clear answers… about the balance sheet, about communication, about data,” he said.
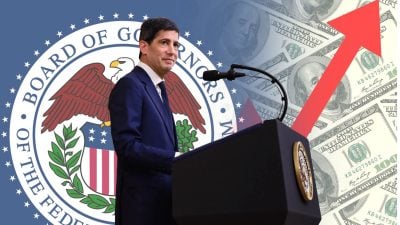
The oil move handed Warsh an immediate vindication. “It actually justifies what Kevin Warsh is saying that he did not want to give forward guidance because things actually change literally the day after the FOMC meeting,” Slok added. The Fed has held the upper bound of the target range at 3.75% since the December 10, 2025 cut, and the bond market has already started doing the talking the Fed will not. The 10-year Treasury yield slipped to 4.49% on June 17, down from a 12-month high of 4.67% on May 19. That repricing tightens or loosens financial conditions faster than any Fed speech, which is precisely the dynamic Warsh appears comfortable leaving in place.
A dot plot that aged in 24 hours
The hawkish print landed loud. “Out of those 18 dots, nine said the Fed will be hiking this year. That’s a very, very hawkish signal,” Slok noted, before pivoting to how quickly that signal had decayed. “Fed funds futures are saying the Fed hike is already now coming in September. That’s a dramatic change from before the meeting, when the expectation was January… we will get volatility in the opposite direction.”
The underlying inflation picture still gives the hawks cover. Core PCE, the Fed’s preferred gauge, sits at 129.63 as of April 1, 2026, a steady climb from the 126.121 reading in June 2025. The EIA’s May Short-Term Energy Outlook still expects Brent to average $89 per barrel in the fourth quarter of 2026 and $79 in 2027 as Middle East supply returns, which would extend the disinflationary impulse Slok is flagging. The tension between sticky core services inflation and a collapsing energy complex is the central puzzle the September meeting will have to resolve.
What investors should take from this
The setup is messy in a useful way. The Fed’s own median dot points to a hike, the futures market points to a hike pulled forward to September, and the commodity tape points to disinflation that could erase the need for either. JPMorgan‘s (NYSE:JPM) 2026 outlook had the market pricing roughly 80 basis points of cuts through 2026 heading into the year, an assumption that now looks brittle in both directions.
Slok’s broader point is that the rate path is genuinely data-dependent, and the data are moving in 48-hour cycles. Warsh appears willing to let that volatility do its work rather than paper over it with guidance the next data print will embarrass. For positioning, that argues for shorter duration bets on rates, a bias toward quality in credit, and skepticism toward any equity narrative that requires the Fed to commit to a direction it has explicitly refused to commit to.
Contact [email protected] for any questions or corrections.