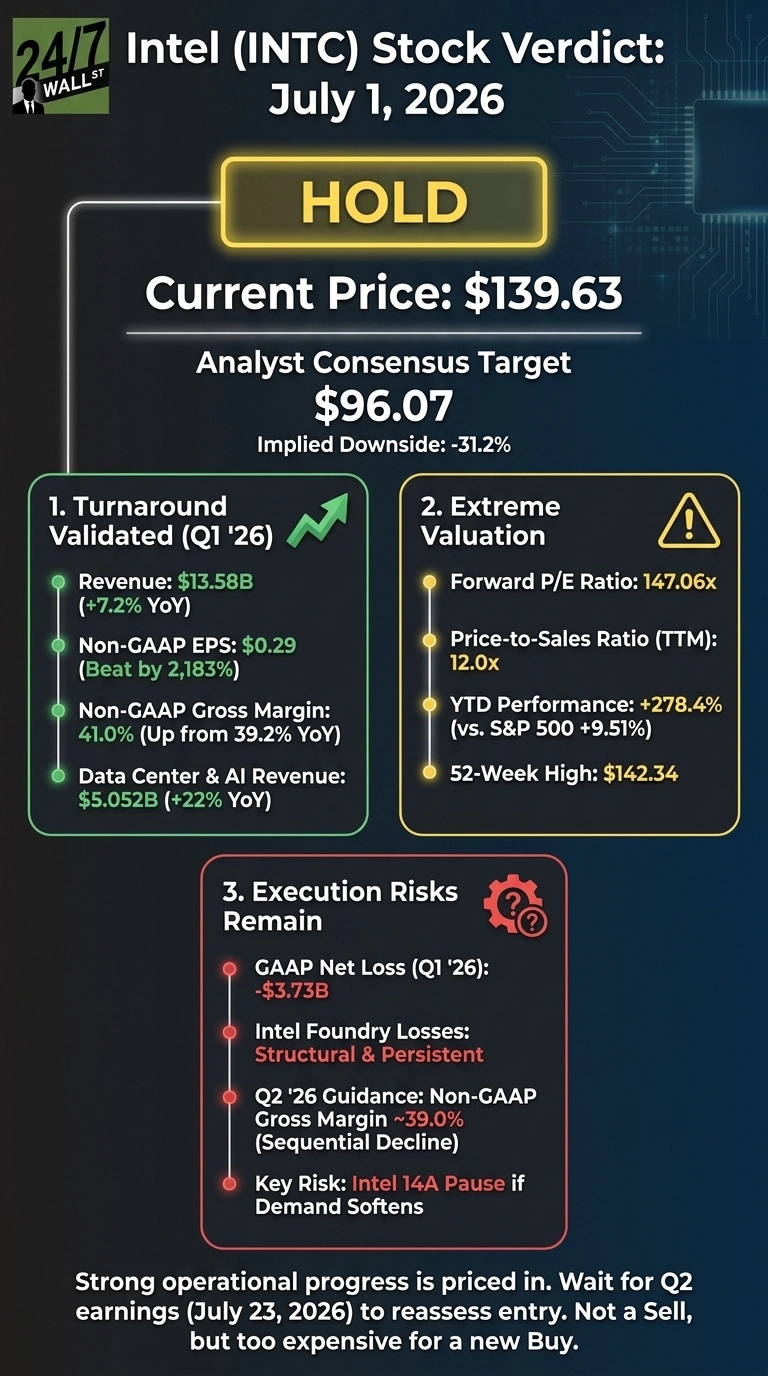
At $139.63, Intel (NASDAQ:INTC | INTC Price Prediction) is a hold. After a 278.4% year-to-date run into a fresh 52-week high, the setup demands a view rather than a reflex.
Intel is the world’s largest x86 CPU designer and increasingly a contract chip manufacturer under CEO Lip-Bu Tan. The turnaround thesis rests on three legs: Intel Foundry scaling on Intel 18A nodes in Arizona and Oregon, Data Center and AI regaining share, and a rebuilt balance sheet backed by NVIDIA’s $5.0B equity investment and SoftBank’s $2B stake.
The stock has traveled from $21.58 at the Q2 2025 filing to near $142.34. Six consecutive revenue beats and a Q1 2026 EPS surprise landed the shares in rarefied air. The question now is whether fundamentals can grow into the price.
The Bull Case: A Foundry Story Finally Working
Q1 2026 delivered the clearest operational proof point yet. Non-GAAP EPS came in at $0.29 against $0.0127 consensus, revenue of $13.577 billion grew 7.2% year over year, and non-GAAP gross margin expanded to 41% from 39.2%.
Segment mix validates the AI thesis. Data Center and AI grew 22% to $5.052B and Intel Foundry rose 16% to $5.421B. Xeon 6 was selected as the host CPU for NVIDIA’s DGX Rubin NVL8 systems, and a multiyear Google partnership adds custom ASIC IPU co-development.
Cantor Fitzgerald raised its target to $150 from $90 on compute strength. Cash and equivalents of $17.247B, up 92.77% year over year, give management runway.
The Bear Case: A 147x Forward Multiple Priced For Perfection
Intel trades at a forward P/E of 147x with trailing EPS of -$0.60 and profit margin of -5.9%. GAAP results show a $3.728B net loss in Q1 2026 driven by a $4.07B restructuring charge tied largely to Mobileye impairment.
Intel Foundry losses remain structural. Operating losses ran $2.51B in Q4 2025 and $3.2B in Q2 2025, and management flagged potential pause of Intel 14A if customer demand falls short. Q2 2026 guidance calls for non-GAAP EPS of $0.20 and gross margin easing to 39%, both sequential declines.
Sentiment is cooling. Reddit’s most-engaged thread carries the title “Intel Stock Price Miracle” at a bearish sentiment score of 28, and Goldman Sachs initiated coverage at Neutral, preferring competitors.
The Hold Case: Right Company, Wrong Entry
The fundamentals argue against a sell. Six consecutive revenue beats, expanding margins, year-over-year growth, and validated foundry customers are exactly what a turnaround should show. Beta of 2.228 and institutional ownership at 64.042% point to active market engagement.
Yet the entry point is punishing. A 50-day moving average of $108.39 sits well below the current price, and the 200-day at $58.23 underscores how compressed this move has been. New capital deployed here buys 2028 earnings at a multiple that assumes flawless 18A ramp and continued DCAI acceleration.
Existing holders have a business improving quarter by quarter. New buyers pay for that improvement plus a premium for hope. Those are two different trades.
What The Data Shows
Intel trades at $139.63 against a Wall Street consensus price target of $96.07, implying downside of 31.2% if the crowd is right. Cantor Fitzgerald’s $150 outlier suggests dispersion is widening as the story evolves.
Of 48 covering analysts, the breakdown skews defensive:
- Strong Buy: 2
- Buy: 10
- Hold: 31
- Sell: 2
- Strong Sell: 3
Intel is up 278.4% year to date and 523.35% over one year, against an S&P 500 that returned 9.51% year to date and 20.87% over one year. On a price-to-sales of 12.0 and EV/EBITDA of 57.54, expectations have run well ahead of fundamentals.
Why Waiting Is The Right Call
At $139.63, Intel is a hold. The turnaround is real, but the price reflects a best-case ramp not yet reported. Q2 2026 earnings on July 23, 2026 will show whether the guided $13.8B to $14.8B revenue band and 39% gross margin can support the multiple. That is the moment to reassess.
The upgrade trigger is straightforward: a Q2 report showing Foundry losses narrowing meaningfully, DCAI growth above 20%, and management pointing to sustained 18A pricing power. That would justify the current multiple. The downgrade trigger is equally clean: any 14A pause, a Foundry customer exit, or sequential margin compression would remove fundamental support and turn this into a Sell.
The cost of patience is small. Missing another leg higher on a stock already up 21.76% in a month is manageable. The cost of buying 147x forward earnings into a July report the sell side expects to fall short is not.
Own it if you already do. Wait for the next earnings report before writing a new check.
Contact [email protected] for any questions or corrections.