General Motors (NYSE: GM | GM Price Prediction) and Ford (NYSE: F) both reported Q1 2026 results in late April, and the earnings reports revealed two very different Detroit strategies. GM leaned on unified Ultium battery scale, a richer sales mix, and heavy share retirement. Ford leaned on hybrids, F-Series demand, and a fast-growing Ford Pro software business while still absorbing steep EV losses.
Ultium Scale Lifts GM. Model e Still Bleeds at Ford.
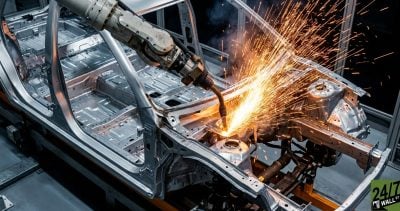
GM delivered adjusted EPS of $3.70 against a $2.6393 estimate, its fourth consecutive beat. EBIT-adjusted reached $4.25 billion, up 21.9% YoY, with GMNA margin expanding to 10.1%. A $1.077 billion charge to realign Ultium capacity stung GAAP results, yet it signals discipline rather than retreat. Chevrolet, GMC, Buick, and Cadillac all pull from the same battery architecture, which is the structural cost lever the bulls keep pointing to.
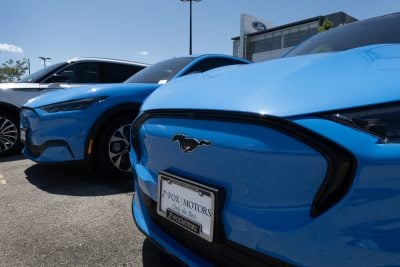
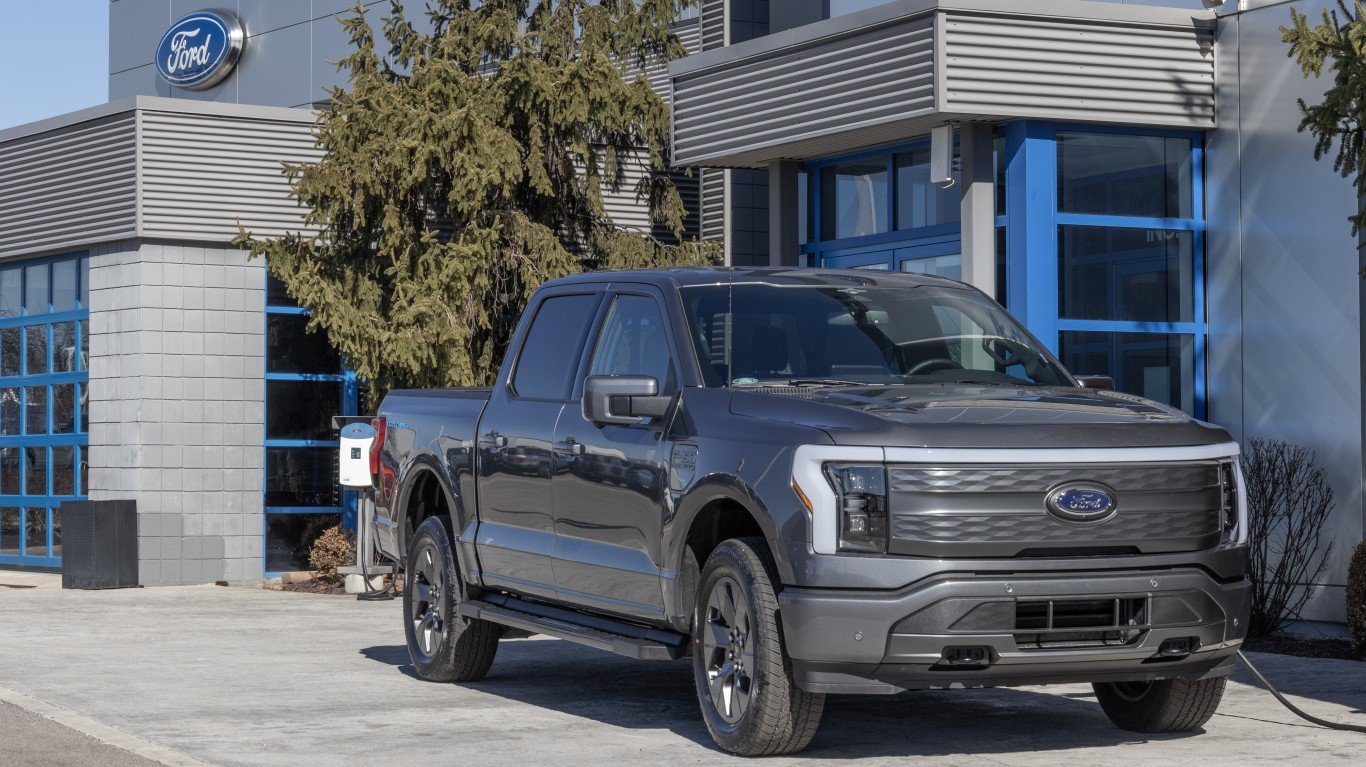
Ford’s headline was flashier and messier. Adjusted EBIT jumped $2.5 billion YoY to $3.49 billion, but a $1.3 billion IEEPA tariff benefit did much of the heavy lifting. Ford Blue produced $1.94 billion in EBIT on F-Series, Bronco, and Explorer strength, and Ford Pro paid software subscriptions grew 30% to 879,000. Model e still lost $777 million in the quarter, with a full-year loss guide of $4.0 to $4.5 billion.
Unified Platform vs. Segmented Complexity
Ford’s structurally divided corporate segments create engineering redundancies and higher warranty costs, while GM’s unified platform architecture drives down manufacturing costs across its next-generation fleet. That framing shows up in the capital returns too.
| Lens | GM | Ford |
| Q1 Buybacks | $800M | $311M |
| Diluted Share Count | 926M vs 1,002M | 3.91B outstanding |
| Quarterly Dividend | $0.18 (raised 20%) | $0.15 |
| Forward P/E | 6 | 8 |
GM’s FY2026 EPS-adjusted guide climbed to $11.50 to $13.50. Ford lifted adjusted EBIT to $8.5 to $10.5 billion, but commodity headwinds of roughly $2 billion, led by aluminum, keep the picture cloudy.
The Next Test Is China and Model e
I will be watching whether GM can arrest China share erosion after worldwide sales slipped to 1.295 million units from 1.449 million. You should keep an eye on Ford’s Universal EV platform ramp and Ford Energy build-out, which are absorbing roughly $1 billion in incremental Model e investment this year.
Why I Lean Toward GM Right Now
Given the quarter, I lean toward GM. Mary Barra’s playbook of pairing a unified battery platform with a 926 million share count and a raised guide feels more durable than Ford’s tariff-aided EBIT jump. For turnaround-focused investors, Ford Pro’s 879,000 paid subscriptions and a 4.28% yield remain part of the bull case. I would rethink my view if GM’s automotive operating cash flow stays weak or China losses accelerate. For now, the buyback math and Ultium leverage tilt the setup toward GM.
Contact [email protected] for any questions or corrections.