Microsoft vs Oracle: One Thriving, One Burning Cash
Both companies posted blockbuster AI cloud numbers, yet the market treated them like night and day. The reason comes down to a fundamental split in how each is funding its AI ambitions, and one balance sheet tells a story investors…

Microsoft (NASDAQ: MSFT | MSFT Price Prediction) and Oracle (NYSE: ORCL) both posted AI-driven cloud numbers, yet the market rewarded one and punished the other.
Microsoft’s Q3 FY2026 report on April 29, 2026 looked like a cash machine humming along. Oracle’s Q4 FY2026 report on June 10, 2026 looked like a company betting the balance sheet on AI infrastructure.
Azure Prints Cash. Oracle Prints Backlog.
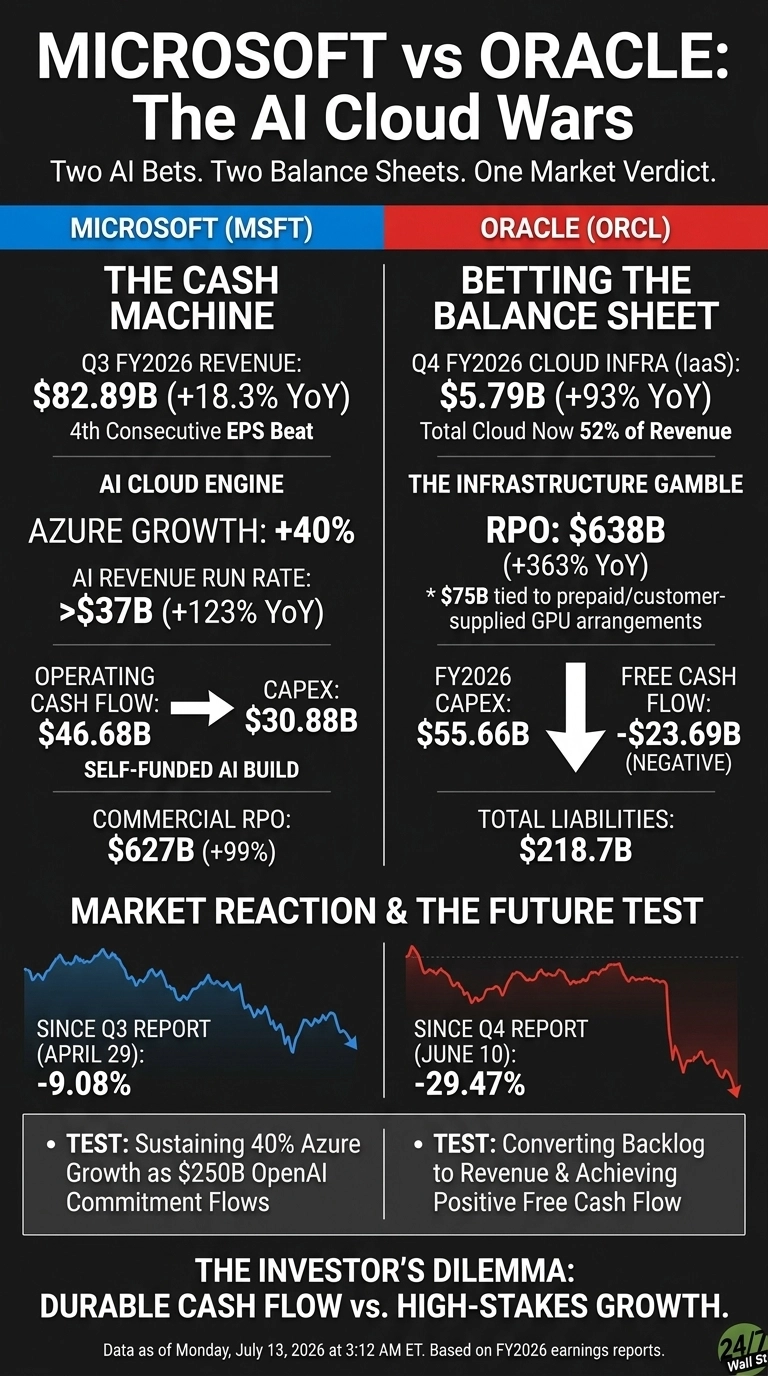
Microsoft’s quarter felt boringly good. Revenue reached $82.886 billion, up 18.3% year over year, and EPS came in at $4.27 versus $4.0706 expected, the fourth consecutive beat. Intelligent Cloud grew to $34.681 billion (+30%), with Azure and other cloud services up 40%.
Satya Nadella told investors “AI business surpassed an annual revenue run rate of $37 billion, up 123% year-over-year.” Commercial RPO climbed to $627 billion, nearly doubling. Microsoft funded its $30.876 billion capex quarter out of $46.679 billion of operating cash flow.

Oracle’s story runs harder and hotter. Cloud infrastructure grew 93% to $5.787 billion, and total cloud is now 52% of revenue, up from 43% a year ago. RPO exploded to $638 billion, up 363%, though $75 billion is tied to prepaid or customer-supplied GPU arrangements.
Software license revenue slipped 6%, a reminder of the shrinking legacy base. The price of that pivot shows up in full-year capex of $55.663 billion and free cash flow of negative $23.686 billion.
Two AI Bets, Two Balance Sheets
Microsoft spreads chips across Microsoft 365, LinkedIn, Dynamics, Windows, and Xbox while tripling down on AI capex.

Oracle pursues something narrower and braver. Co-CEO Clay Magouyrk framed the strategy plainly: “We are committed to Cloud Neutrality because we believe that our customers should be able to run their Oracle databases in any cloud they choose.” That is why the Multicloud AI Database jumped 404% in Q4, embedding Oracle inside Amazon, Google, and Microsoft datacenters.
| Lens | Microsoft | Oracle |
| Core Bet | Agentic computing across a broad stack | AI infrastructure and multicloud database |
| Funding Model | Self-funded from operating cash | ~$40B debt and equity raise planned in FY2027 |
| Key Vulnerability | OpenAI dependence, capex payback | Negative FCF, large-deal concentration |
Microsoft is down 9.08% since its April 29 report, while Oracle collapsed 29.47% in the month after June 10. Skeptics noticed the $218.703 billion in total liabilities.
The Next Test Is Whether the Backlog Converts
Oracle guided FY2027 revenue to $90 billion with non-GAAP EPS of $8.05, and Q1 cloud growth of 58% to 64%. Keep an eye on whether that RPO becomes recognized revenue on schedule, because equity issuance and $124 billion in existing debt leave little margin for slippage.
For Microsoft, the tell will be Azure sustaining 40% growth as the $250 billion incremental OpenAI Azure commitment begins to flow. Investors curious about how these bets fit into a wider AI portfolio can look at the AI Boom Seven framework.

Why I Lean Toward Microsoft Right Now, With One Caveat
If I had to pick today, I would lean Microsoft. Trading at a forward P/E near 20 with 46.3% operating margins, the risk profile fits how I invest: durable cash flow funding the AI buildout.
Oracle’s growth is more thrilling on paper, and the PEG ratio of 0.795 looks tempting. But I want to see one clean quarter of positive free cash flow before I trust the pivot. If you are a turnaround investor comfortable with leverage and volatility, Oracle offers real upside from $140.64. I would rather own the compounder that already knows how to print cash.
Contact [email protected] for any questions or corrections.
Vandita Jadeja is a financial publisher with over a decade of experience writing about financial topics, including investment, savings, retirement, insurance and banking. Vandita is a Chartered Accountant who loves to debunk financial concepts for readers.
Her work has appeared on sites that include The Motley Fool, InvestorPlace, and Benzinga. She covers investing and focuses on stock picks and price prediction for 24/7 Wall St.
When not looking for the next stock investment opportunity, she can be found traveling, reading, chasing sunsets and enjoying her iced latte.