This post may contain links from our sponsors and affiliates, and Flywheel Publishing may receive compensation for actions taken through them.
Live coverage has ended. The full story is below.
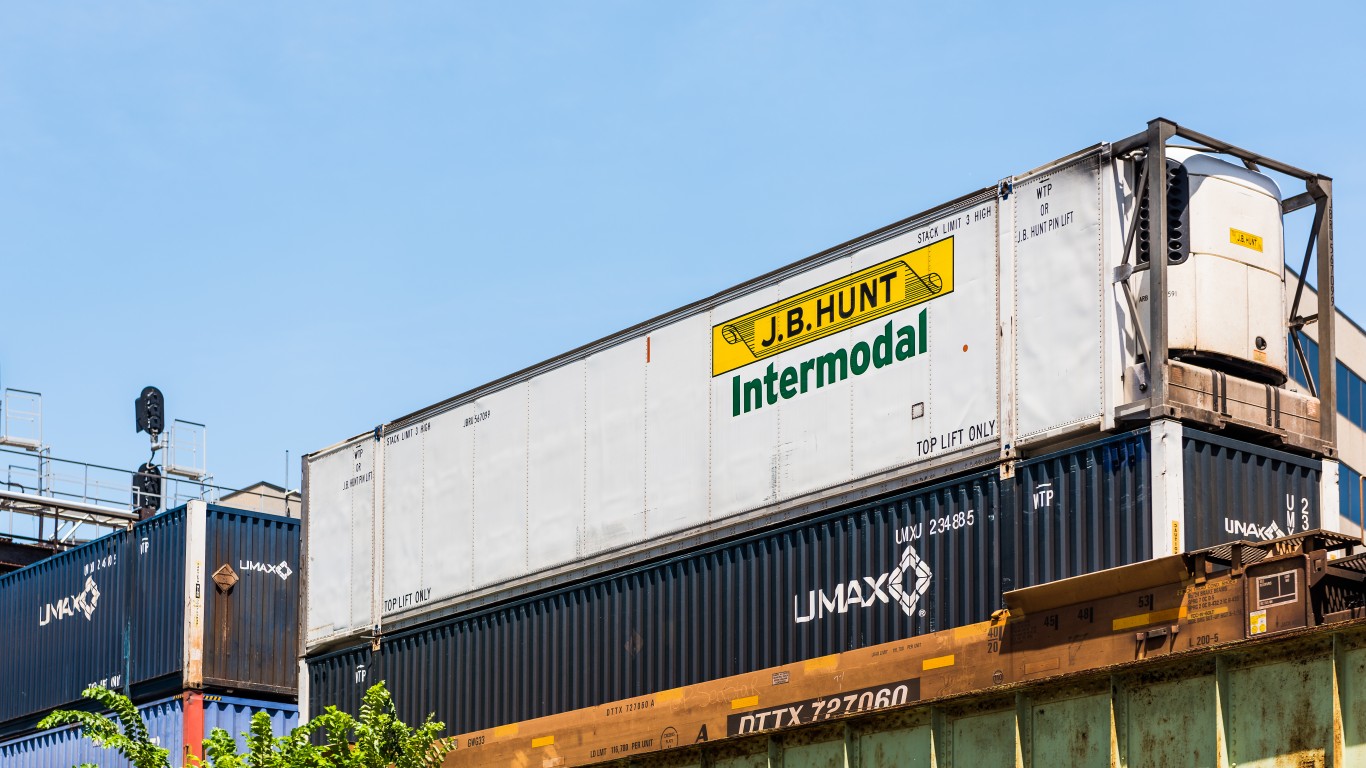
J.B. Hunt Transport Services (NASDAQ:JBHT | JBHT Price Prediction) reports Q2 2026 results tonight at 4:05 PM ET after the market closes. With shares near $277.37 and a P/E of 44, tonight’s numbers must validate the freight-cycle recovery thesis embedded in the stock.
Momentum Meets a Steeper Bar
In Q1, JBHT delivered a clean beat: EPS of $1.49 on revenue of $3.06 billion, up 4.6% YoY, with operating margin expanding to 6.8% from 6.1%. Intermodal set a first-quarter volume record, and operating income there jumped 21%.
Since that April report, JBHT has rallied hard. The stock is up 45.08% year-to-date, and Bernstein upgraded it to Outperform with a $329 target on July 10. Morgan Stanley cut to Underweight at $200, calling much of the upcycle already priced in.
Consensus Estimates
| Metric |
Q2 2026 Est. |
YoY Change |
Q1 2026 Actual |
| Revenue |
$3.25B |
+10.9% |
$3.06B |
| EPS (Normalized) |
$1.7273 |
+31.9% |
$1.49 |
The Street wants sequential acceleration versus Q2 2025 EPS of $1.31. That embeds pricing traction in ICS and Truckload plus continued intermodal leverage. Any slippage in operating margin lands against a stretched multiple.
Watchpoints: Intermodal Pricing and ICS Margin Recovery
Tonight, I’ll be watching how CEO Shelley Simpson frames the freight cycle. In April, she said “we believe we are on a path of recovery” and described capacity as inverted.
Investors will also focus on Integrated Capacity Solutions (ICS) gross margin, which compressed to 12.0% from 15.3%. COO Nick Hobbs noted “we are winning more volume and securing rate increases,” so any sequential improvement validates the bid-season narrative.
Also, I’ll track intermodal pricing discipline. Executive Vice President Darren Field warned transcon bid season had been “more competitive” than expected, and the Eastern network’s 7% load growth requires staying power.
Another metric to watch is cost-to-serve progress, currently pacing north of $130 million for the year versus a $100 million target, plus buyback cadence against the $888 million remaining authorization.
Earnings History
| Quarter |
EPS Surprise |
Reported EPS |
| Q1 2026 |
+3.02% |
$1.49 |
| Q4 2025 |
+4.78% |
$1.90 |
| Q3 2025 |
+20.55% |
$1.76 |
| Q2 2025 |
-0.86% |
$1.31 |
On average, shares moved roughly 10.79% higher seven days after the last earnings release.
Contact [email protected] for any questions or corrections.