This post may contain links from our sponsors and affiliates, and Flywheel Publishing may receive compensation for actions taken through them.
Live coverage has ended. The full story is below.
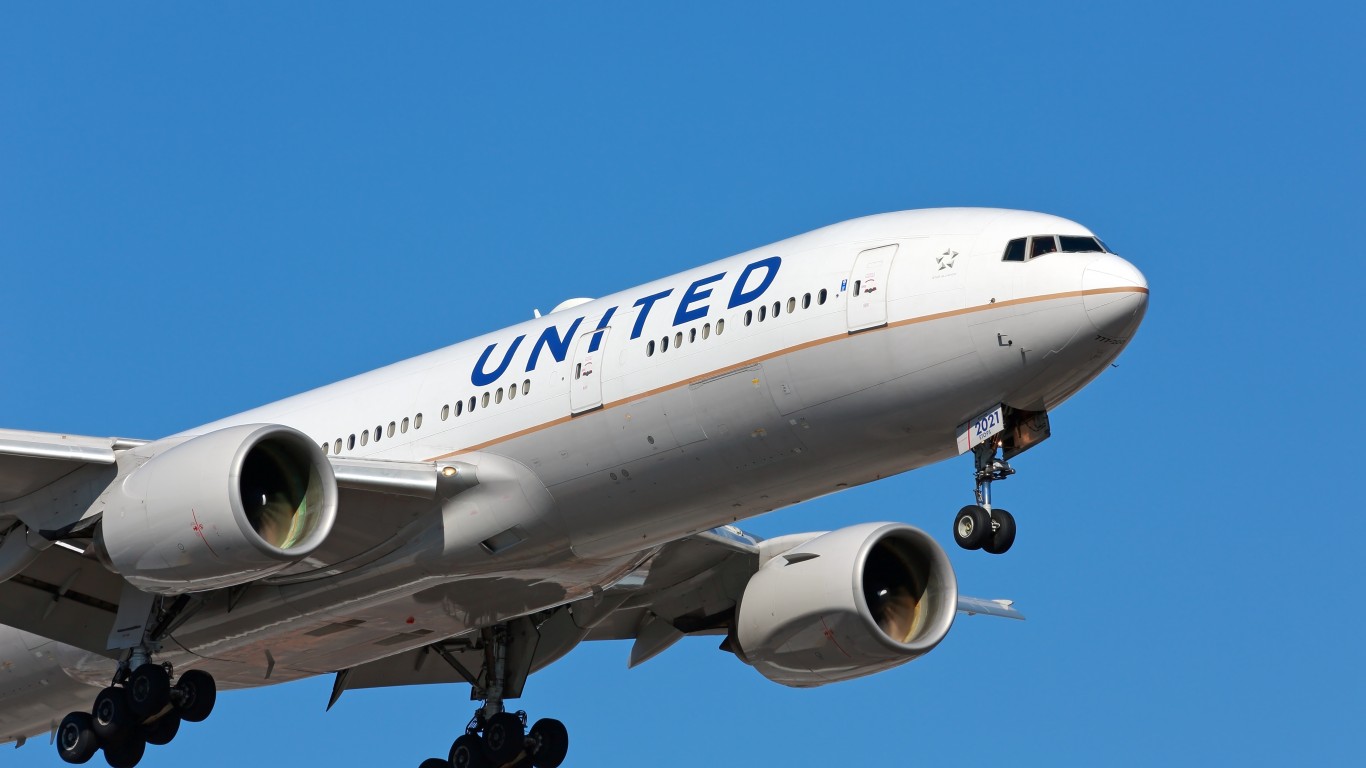
United Airlines (NASDAQ:UAL | UAL Price Prediction) reports Q2 2026 results tonight, July 15, at 4:00 PM ET after the bell, with the earnings call scheduled for 10:30 AM ET the next morning. Shares sit at $121.25, up 39.2% over the past year, raising the bar for the earnings report.
Fuel Recovery Meets Premium Momentum
Q1 delivered $1.19 EPS against a $1.0924 consensus, an 8.93% beat. Revenue rose 10.57% to $14.61 billion, with premium up 14% and loyalty up 13%.
However, fuel jumped to $2.78 per gallon from $2.53, a $340 million headwind. Management responded by pulling 5 points of capacity for the rest of 2026 and lowering the FY EPS band. Shares initially dropped 5.58% on the Q1 earnings report but have since rallied to $120.31.
Consensus Setup
| Metric |
Q2 2026 Guide |
FY 2026 Guide |
| Adjusted EPS |
$1.00 to $2.00 |
$7.00 to $11.00 |
| Fuel Recovery |
40 to 50% |
Ramps to 85 to 100% by Q4 |
| CapEx |
N/A |
Under $8B |
UAL’s forward P/E sits at 12, with a $120.31 share price, indicating meaningful upside to analysts’ consensus price target of $153.97.
Fuel Pacing and Guidance Range Take Center Stage
Tonight, I’ll be watching UAL’s comments around fuel recovery first. CEO Scott Kirby framed Q2 as the toughest quarter of the recovery arc, so the surcharge and mix commentary will tell us whether the upper half of the FY $7-$11 band remains reachable.
Premium and loyalty durability matter next. Both grew by 14% and 13% in Q1, and the JetBlue (NASDAQ:JBLU) Blue Sky collaboration, plus new MileagePlus economics, should extend that runway.
Investors will also focus on international mix, particularly the Middle East, India, and Africa corridor that posted 23.9% passenger revenue growth, alongside Atlantic at 18.9%. CASM (Cost per Available Seat Mile) ran up 5.9%, so analysts will be looking for cost commentary, and the flight attendant tentative agreement covering 30,000 workers.
CEO Kirby said, “We’ll stay nimble in the short term while continuing to grow the airline and invest in our customers, product and people.”
Earnings History
| Quarter |
EPS Surprise |
1-Day Move |
1-Week Move |
30-Day Move |
| Q1 2026 |
+8.93% |
-0.5% |
-3.37% |
+9% |
| Q4 2025 |
+5.41% |
-0.5% |
-5.45% |
-3.42% |
| Q3 2025 |
+3.98% |
+0.97% |
-2.56% |
-8.39% |
| Q2 2025 |
-0.22% |
+1.13% |
-1.63% |
+12.22% |
On average, shares moved -1.99% one week after earnings across the past year.
Contact [email protected] for any questions or corrections.