Amazon’s Trillion-Dollar Capex Gamble vs Shopify’s Lean Profitability Strategy
Amazon is burning through tens of billions in capex to own the AI backbone while Shopify spends almost nothing and still accelerates growth faster. Which strategy survives contact with a softening consumer and a skeptical market?

This post may contain links from our sponsors and affiliates, and Flywheel Publishing may receive compensation for actions taken through them.

Amazon (NASDAQ: AMZN | AMZN Price Prediction) and Shopify (NASDAQ: SHOP) sit on opposite sides of the same retail transaction.
Amazon owns the storefront, warehouse, and increasingly the cloud powering everyone else. Shopify arms independent merchants competing against it. Both posted Q1 2026 results beating revenue expectations, and the contrast reveals where commerce and AI money is flowing.

AWS Reaccelerates While Shopify Crosses $100B in GMV
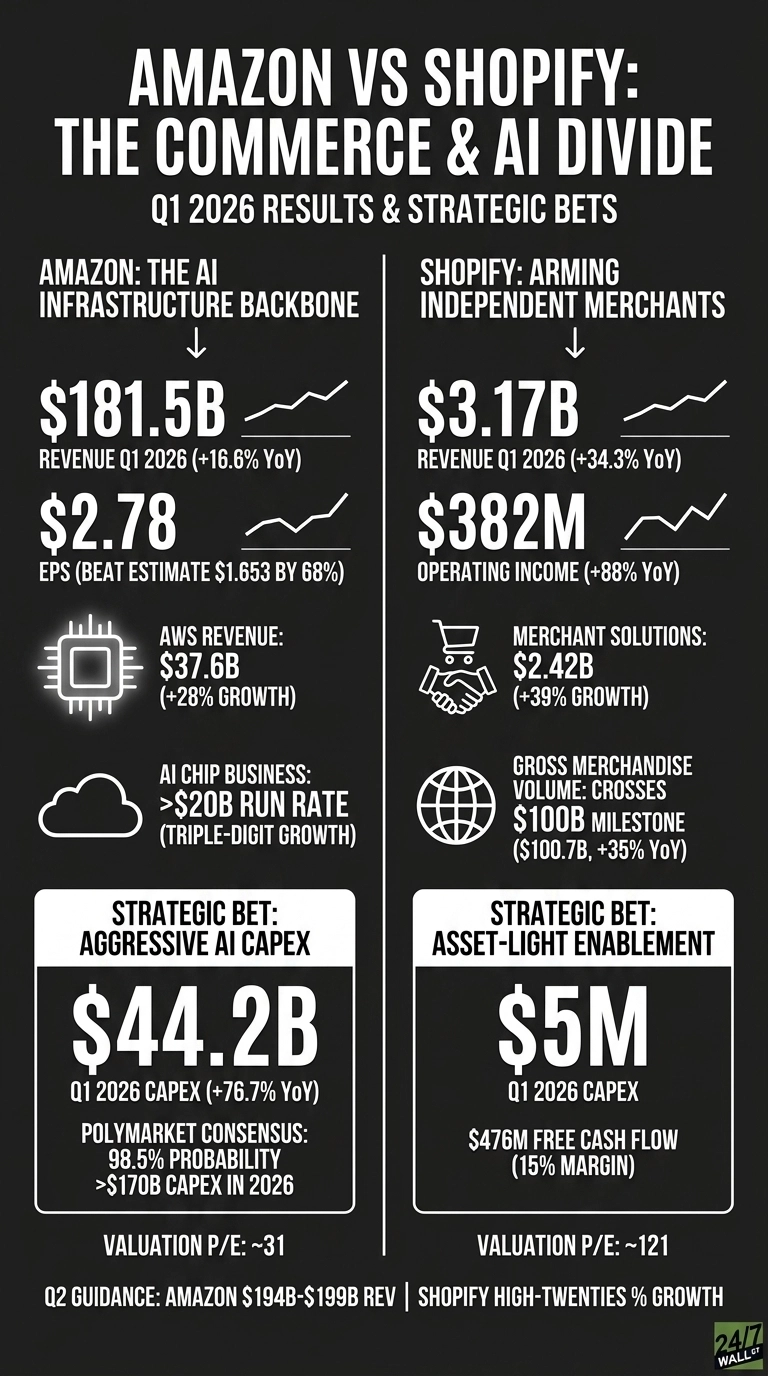
Amazon reported $181.519 billion in revenue, up 16.61%, with EPS of $2.78 against a $1.653 estimate. AWS drove the headline, hitting $37.587 billion in cloud revenue, up 28%, the fastest pace in 15 quarters.
Andy Jassy told investors the chips business (Trainium, Graviton, Nitro) crossed a “$20 billion revenue run rate (growing triple digits year-over-year)”. Advertising cleared $70 billion trailing twelve months, a real second engine.
Shopify reported $3.17 billion in revenue, but growth ran hotter at 34.32%, accelerating from 27% in Q1 2025. Merchant Solutions grew 39% to $2.42 billion. GMV crossed $100.74 billion for the quarter for the first time, up 35%.
Operating income nearly doubled to $382 million, though a $941 million mark-to-market equity hit pushed GAAP net income to negative $581 million. Underlying profit was $360 million.
One Builds the AI Backbone, the Other Arms Merchants
Amazon is spending like a utility. Q1 capex was $44.203 billion, up 76.68%. Anthropic committed to up to 5 GW of Trainium capacity, OpenAI to roughly 2 GW. Polymarket traders assign a 98.5% probability that Amazon 2026 capex exceeds $170B, and 86.5% above $200B. That is a substantial bill for AWS to justify.
Shopify took the opposite approach: capex of $5 million, free cash flow of $476 million, and $491 million in buybacks under a fresh $2 billion program. Merchant lending originations hit $1.349 billion, turning Shop Capital into a real financial services line.
| Lens | Amazon | Shopify |
| Core bet | AI infrastructure and custom silicon | Merchant tools, payments, lending |
| Q1 capex | $44.2B | $5M |
| P/E | 31 | 121 |
| Key risk | Capex payback timeline | SMB merchant health, loan losses |
The Next Test Is Whether Capex and Consumer Spending Cooperate
Amazon guided Q2 revenue to $194 billion to $199 billion. Shopify guided revenue growth in the high-twenties percentage range with mid-teens free cash flow margin. Watch whether Bedrock token growth and Trainium deployments start pulling AWS margins higher despite capex drag. For Shopify, monitor credit losses inside that $1.35 billion lending book if SMB spending softens.
Post-earnings action split. Amazon slipped 5% since its report as the market weighed capex. Shopify recovered 16.19% from its post-earnings dip, though shares are down 22.31% year to date.
The Case for Amazon on Valuation
Amazon offers AWS growing 28% at a 37.7% operating margin, a real ads business, and a chip franchise Reddit compares to AMD and Broadcom, at a P/E of roughly 31. Shopify’s growth is faster, but a 121 trailing P/E leaves little room for consumer weakness.
For higher-beta commerce exposure, Shopify fits. For AI infrastructure at a reasonable multiple, Amazon is cleaner. The setup to watch is whether capex begins converting to cash in the second half.
Contact [email protected] for any questions or corrections.
Vandita Jadeja is a financial publisher with over a decade of experience writing about financial topics, including investment, savings, retirement, insurance and banking. Vandita is a Chartered Accountant who loves to debunk financial concepts for readers.
Her work has appeared on sites that include The Motley Fool, InvestorPlace, and Benzinga. She covers investing and focuses on stock picks and price prediction for 24/7 Wall St.
When not looking for the next stock investment opportunity, she can be found traveling, reading, chasing sunsets and enjoying her iced latte.