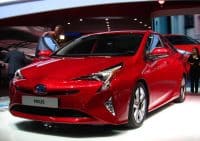
Toyota Made 6 Times More Profit Than Tesla Last Year. Tesla Stock Is Still Worth More Than the Next 37 Automakers Combined.
Toyota dwarfs Tesla in revenue, production, and profit, yet Wall Street prices Tesla as if the opposite were true. The numbers behind that contradiction reveal a bet so large it has quietly swallowed 37 of the world's biggest automakers.


The math has never been kinder to legacy automakers, and it has never mattered less to Tesla’s stock. Tesla (NASDAQ:TSLA | TSLA Price Prediction) carried a market capitalization of $1.423 trillion as of July 21, 2026, per FactSet data cited by the Wall Street Journal. The combined market cap of the next 37 largest consumer vehicle and parts manufacturers on that same date was $1.415 trillion, a list that includes Toyota, BYD, Ferrari, General Motors, Ford, and Hyundai. Tesla alone is worth slightly more than all of them put together.
The Profit Gap Behind the Valuation Gap
Toyota Motor (NYSE:TM) reported net income attributable to owners of the parent of $25.45 billion for its fiscal year ended March 31, 2026. Guidance for the current fiscal year points to roughly $23.8 billion, down about 25% year over year, largely attributed to U.S. tariff pressure. Tesla, by comparison, posted full-year 2025 GAAP net income of $3.8 billion and non-GAAP net income of $5.9 billion. Using Toyota’s guided fiscal figure against Tesla’s GAAP result produces the roughly 6.3x gap referenced in the headline. Toyota’s calendar-year 2025 net income of approximately $31.45 billion would push the ratio closer to 8x.
Toyota also absorbed a direct hit from trade policy. The company disclosed that U.S. tariffs negatively impacted FY2026 operating income by $8.81 billion, and its North America segment swung to an operating loss of $1.23 billion.
A Gap That Keeps Widening
The “worth more than the competition combined” phenomenon is not new, but the scope has expanded. At the end of 2020, Tesla’s market cap was $0.669 trillion versus $0.663 trillion combined for just the next 7 largest automakers. Five years later, it takes 37 rivals to match Tesla’s market value.
Per-Vehicle Economics Are Converging
As a separate data point, per-vehicle profitability tells its own story. Tesla’s profit per vehicle fell to about $2,140 in Q1 2026, down roughly 40% from $3,438 in the same period in 2025. Toyota’s profit per unit for the comparable period was reported at roughly $2,078, nearly matching Tesla’s.
Scale Still Belongs to the Incumbents
Tesla’s full-year 2025 revenue was $94,827,000,000. Toyota’s FY2026 consolidated revenue was $323.62 billion, with $132.70 billion from North America alone. Tesla trades at a trailing P/E of 346; Toyota trades at 10.
What Investors Are Actually Pricing
Tesla shares are down 28.91% year to date through July 23, 2026, following an earnings report in which non-GAAP EPS of $0.33 missed the $0.5367 estimate by 38.51% and operating margin compressed to 1.4%. Management framed the spending surge as a bridge to a different business, telling investors that “Over time, Tesla expects hardware-related profits to be accompanied by an acceleration of AI, software, and fleet-based profits.” That is the bet embedded in the market cap, priced against future earnings power rather than the current-year income statement.
Contact [email protected] for any questions or corrections.
I've spent more than 15 years inside enterprise software, working alongside the finance, sales operations, and HR leaders who run the revenue engines at some of the largest tech companies in the country.
My day job is helping enterprise executives make smarter decisions about retention, compensation, and growth. These are the same operational levers that show up in every earnings report investors actually read. That perspective shapes my writing for 24/7 Wall St.
The headline numbers are easy. The interesting stuff is underneath: how companies make money, what executives are worried about, and what any of it means for the person checking their 401(k) on a Sunday afternoon. I write about personal finance and business as someone who has spent her career inside the rooms where these decisions get made.