Exxon Posts Its Best Profit in Four Years, Here’s Where It’ll End The Year
Exxon just delivered its strongest quarterly profit in four years and rewarded shareholders with a 44% annual rally, but surging share prices and a troubling free cash flow drop are setting up a collision that could determine whether the stock…


Exxon Mobil (NYSE:XOM | XOM Price Prediction) posted its best underlying quarterly profit in four years, with shares hitting fresh highs. After a 30.9% year-to-date run, risk/reward looks stretched.
Our 24/7 Wall St. price target for Exxon is $139.86, implying 9.14% downside from current levels. The recommendation is hold with 90% confidence, reflecting strong operations colliding with a rich multiple.
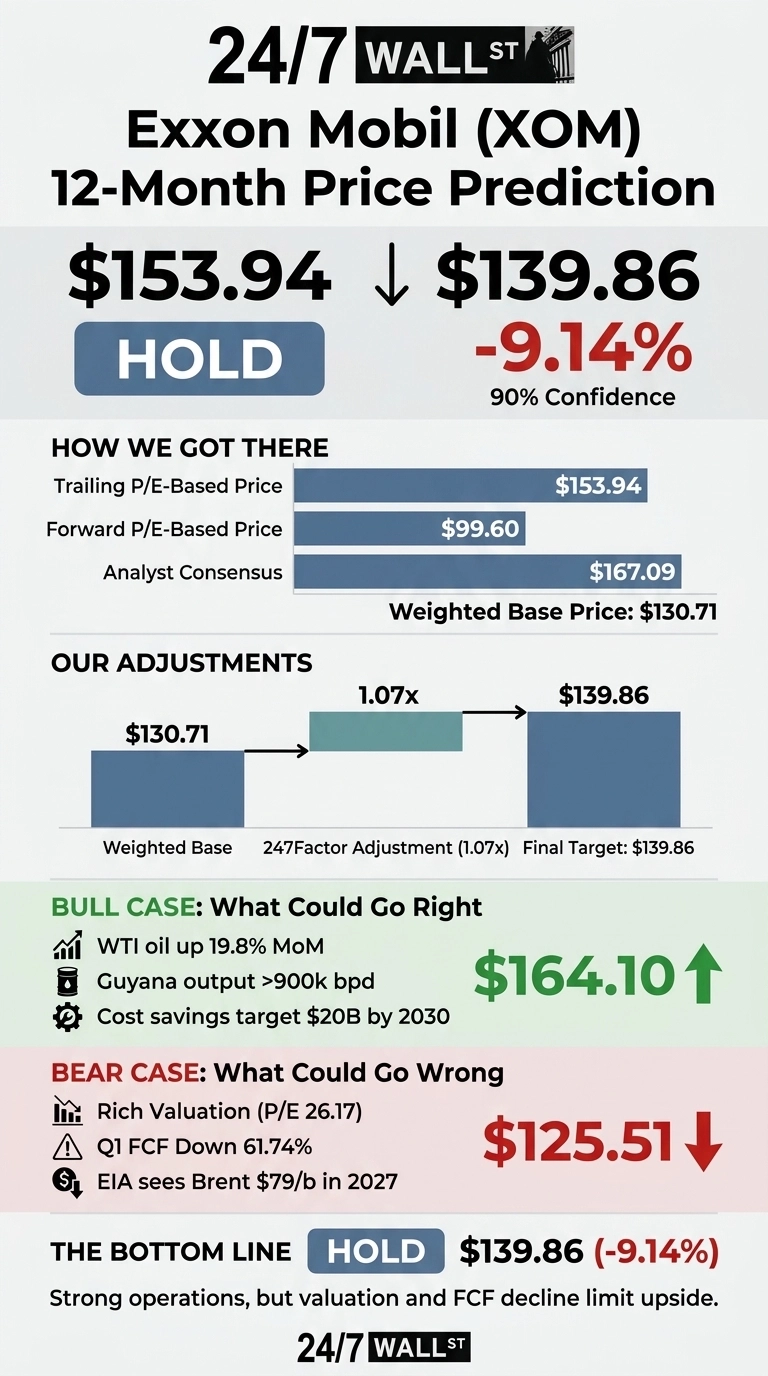
24/7 Wall St. Price Target Summary
| Metric | Value |
|---|---|
| Current Price | $153.94 |
| 24/7 Wall St. Price Target | $139.86 |
| Upside/Downside | -9.14% |
| Recommendation | HOLD |
| Confidence Level | 90% |
Why We Could Be Wrong on Exxon
Our price target sits below current trading levels, and the bull argument is real. Golden Pass LNG Train 1 shipped its first cargo in April 2026, Guyana keeps beating schedule, and WTI is up 19.8% month over month to $84.25. If Brent stays elevated on Middle East risk, Exxon could easily exceed our target.

A Four-Year Profit Peak Meets a 44% Rally
Exxon shares are up 43.65% over the past year and 14.06% in July alone, sitting just 5% below the 52-week high of $175.22.
Q1 2026 delivered adjusted EPS of $1.16 versus $1.01 expected, a 15.15% beat and the fourth straight quarter above consensus.
Underlying earnings hit $8.77 billion versus $7.58 billion a year earlier, the strongest underlying quarter in roughly four years, despite GAAP results dinged by $3.88 billion in unfavorable derivative mark-to-market timing and $706 million in Middle East disruption losses. CEO Darren Woods called it a “fundamentally stronger company”.
The Case for $164 and Higher
Bulls cite a genuinely improved earnings engine. Cumulative structural cost savings since 2019 hit $15.6 billion, targeting $20 billion by 2030. Guyana crossed 900,000 barrels per day, Permian hit records, and advantaged assets grew to 59% of production.
Capital return is exceptional: $20 billion in 2026 buybacks planned and 43 consecutive years of dividend growth. Analyst consensus sits at $167.09, with bull-case scenarios reaching $164.10, a 6.6% return. If Brent holds near the EIA’s $106/b Q2 forecast, upside estimates look conservative.
What Could Send Shares Back to $125
The bear case starts with valuation. Exxon trades at a a premium trailing multiple, well above peers, and the 224.56% five-year rally already prices in significant upside.
Q1 free cash flow fell 61.74% to $2.70 billion as capex climbed, and the effective tax rate jumped to 40%. The EIA expects Brent to fall to $79/b in 2027 as Middle East supply returns. Our bear-case scenario points to $125.51, an 18.47% drop.
How Exxon Compares to Chevron and ConocoPhillips
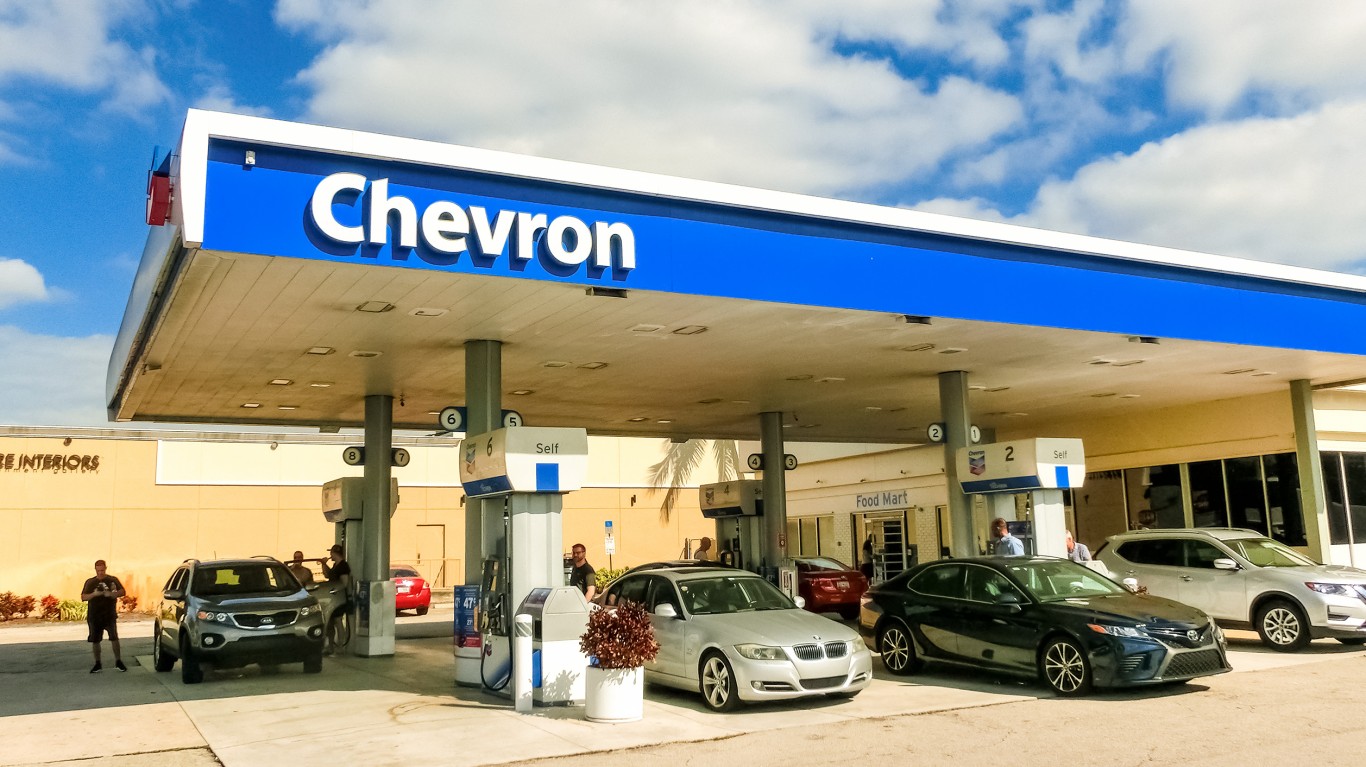
Chevron (NYSE:CVX) trades at a forward P/E of 14 versus Exxon’s 14, but its trailing P/E is 19 versus Exxon’s 26. Chevron’s analyst target of $215 implies meaningful upside, suggesting the Street sees Exxon’s premium as harder to justify.
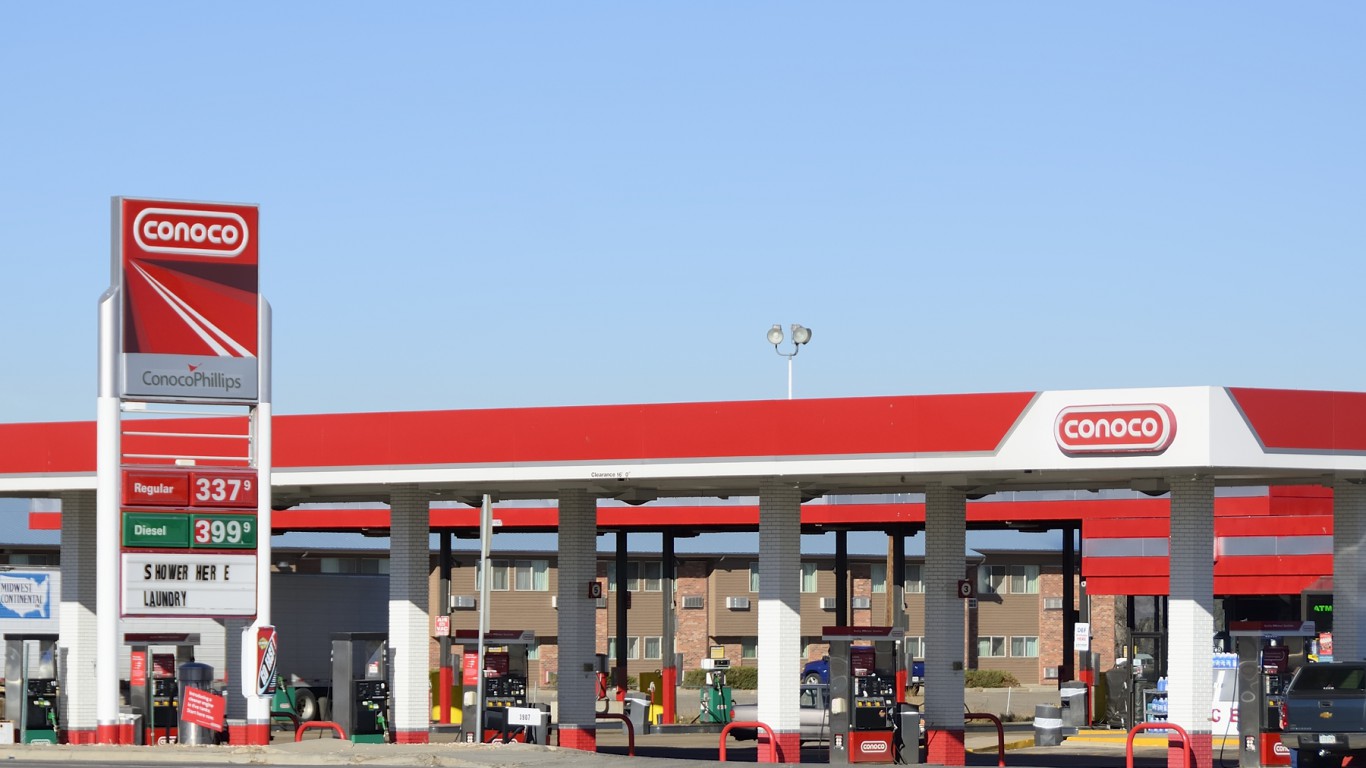
ConocoPhillips (NYSE:COP) offers a pure upstream contrast. COP trades at a a lower forward multiple with a a lower PEG than Exxon. COP looks cheaper per unit of growth, reinforcing our view that Exxon’s target should sit closer to $140 than $167.
Model Verdict: Rich Multiple Meets Stronger Engine
The 24/7 Wall St. price target is $139.86, recommendation hold, confidence 90%. Valuation tips the scale: this is a fundamentally stronger Exxon, but a premium trailing multiple and 5% from the 52-week high leaves little margin for error.
The setup improves if crude sustains above $90 and free cash flow reaccelerates in Q2. Downside risk grows if Brent slides toward the EIA’s 2027 forecast. The current dividend yield sits at 2.6%.
Here is where our model projects Exxon could trade, assuming current growth trajectories hold.
| Year | 24/7 Wall St. Price Target |
|---|---|
| 2026 | $148.65 |
| 2027 | $145.00 |
| 2028 | $150.00 |
| 2029 | $155.00 |
| 2030 | $141.83 |
These projections assume Exxon continues executing on cost savings and advantaged-asset growth. Significant upside or downside could come from sustained Middle East disruption or faster-than-expected energy transition.
Contact [email protected] for any questions or corrections.
Vandita Jadeja is a financial publisher with over a decade of experience writing about financial topics, including investment, savings, retirement, insurance and banking. Vandita is a Chartered Accountant who loves to debunk financial concepts for readers.
Her work has appeared on sites that include The Motley Fool, InvestorPlace, and Benzinga. She covers investing and focuses on stock picks and price prediction for 24/7 Wall St.
When not looking for the next stock investment opportunity, she can be found traveling, reading, chasing sunsets and enjoying her iced latte.