Target Stock at 52-Week High: Buy, Sell or Hold?
Target has surged 50% this year on the back of one standout quarter, but the analyst consensus now sits below the stock price and the consumer backdrop looks shakier by the month. Before you make a move, the full picture…

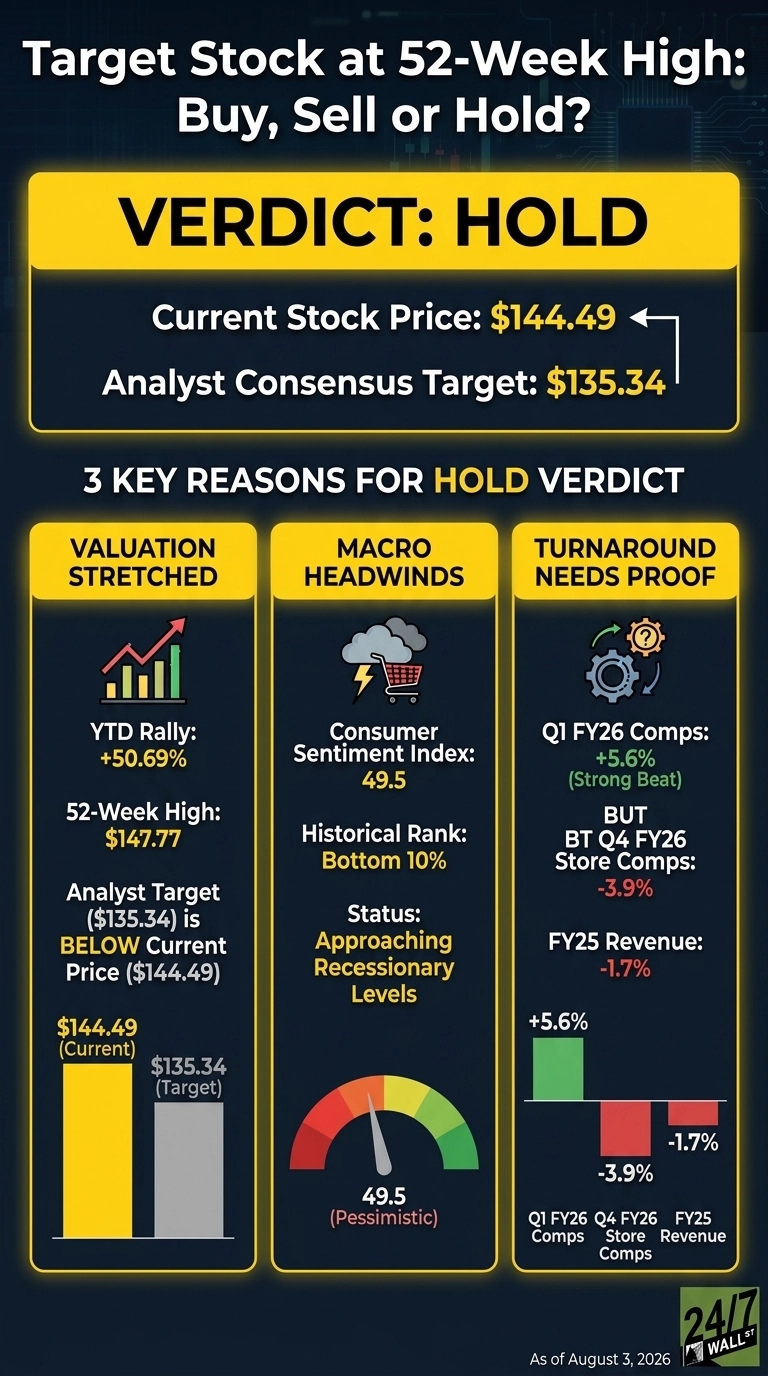
At $144.49, Target (NYSE:TGT | TGT Price Prediction) is a hold. After a 50.69% year-to-date rally that has pushed the stock within reach of its $147.77 52-week high, the risk/reward has narrowed as analyst targets sit below the market price.
Target is the second-largest general merchandise retailer in the United States, operating 2,000-plus stores across food, apparel, home, beauty, and hardlines.
The business spent most of fiscal 2025 shrinking, with full-year revenue down 1.7% and adjusted EPS falling year over year. CEO Michael Fiddelke, appointed in 2025, delivered a Q1 FY26 inflection that reset the narrative and ignited the rally in the shares.
Why the Turnaround Story Has Legs
Q1 FY26 was the cleanest quarter Target has posted in two years. EPS of $1.71 beat the $1.46 consensus by 17.03%, revenue grew 6.7%, and comparable sales rose 5.6% on 4.4% traffic growth. All six merchandise categories grew, digital comps advanced 8.9%, and same-day delivery via Target Circle 360 expanded more than 27%.
Management raised full-year guidance to roughly 4% sales growth and pointed EPS toward the high end of the $7.50 to $8.50 range. High-margin ancillary revenue is compounding fast, with Target Plus GMV up nearly 60% and Roundel advertising growing double digits. At a 17 forward P/E, the stock is not demanding relative to its long-run average.
Why the Rally Looks Stretched
The macro backdrop is hostile to discretionary retail. University of Michigan consumer sentiment sits at 49.5, in the bottom 10% of its historical range and approaching recessionary territory. Q1 masked persistent weakness: Q4 FY26 comparable store sales fell 3.9%, transactions declined 2.9%, and management’s guidance still bakes in tariff uncertainty.
Analyst consensus target of $135.34 sits below the current price, insider activity is net selling, and full-year FY26 net income fell 9.44%. Buyers at $144 are paying for execution not yet proven across a full year.
Why Patience Beats Conviction
Target has real momentum, but the stock has already re-rated to price it in. A pullback into the $115 to $125 range on any comp softness would reopen a compelling entry, while another clean quarter with positive comps could justify a higher multiple. Watch Q2 comps, tariff pass-through commentary, and the fall Target Beauty Studio rollout across more than 600 stores.
What the Data Says at 52-Week Highs
Target currently trades at $144.49 against an analyst consensus target of $135.34, implying roughly 6% downside from 38 covering analysts. The breakdown skews cautious: 2 Strong Buy, 10 Buy, 23 Hold, 3 Strong Sell.
Shares have gained 49.99% over the past year, dramatically outrunning the S&P 500’s roughly 15% gain over the same window. Valuation sits at a 19 trailing P/E with a 3.14% dividend yield backed by 235 consecutive quarterly payments.
The Verdict: Hold Through the Proof
At $144.49, Target is a Hold.
The one-quarter turnaround is genuine, but a single strong report does not undo a full year of comp declines, and the analyst target below spot price reflects that skepticism. Fiddelke said “a single good quarter has never been our goal”. The market has already awarded him the benefit of the doubt in the price.
Existing holders may find justification to stay put and collect the $4.54 annual dividend while the merchandising reset plays out. Prospective buyers have reason to wait for Q2 results to confirm that comps stay positive, that tariff exposure has been absorbed, and that traffic gains hold through weakening consumer sentiment.
A Buy trigger emerges on a second consecutive positive-comp quarter with margin expansion; a Sell trigger emerges on any comp reversal or guidance cut. Waiting is the right call because Target has re-rated ahead of the evidence, and the next report will decide whether $144 was a floor or a ceiling.
Contact [email protected] for any questions or corrections.
Vandita Jadeja is a financial publisher with over a decade of experience writing about financial topics, including investment, savings, retirement, insurance and banking. Vandita is a Chartered Accountant who loves to debunk financial concepts for readers.
Her work has appeared on sites that include The Motley Fool, InvestorPlace, and Benzinga. She covers investing and focuses on stock picks and price prediction for 24/7 Wall St.
When not looking for the next stock investment opportunity, she can be found traveling, reading, chasing sunsets and enjoying her iced latte.