Price Prediction: Target Stock Will Hit The $200 Milestone on This Date
Target stock has surged over 70% this year and CEO Michael Fiddelke's turnaround is gaining real traction, but Wall Street analysts still price in a loss from here. Here is why the numbers and the narrative are pointing in opposite…

Target has done something remarkable in 2026. The stock has ripped higher after two brutal years, and CEO Michael Fiddelke’s turnaround is starting to look real. Traffic is up, all six merchandising categories are growing, and a monster Q2 earnings report reset the story.
Target (NYSE:TGT | TGT Price Prediction) now trades at $163.33, up 71.62% year to date and 83.19% over the last year. The question I want to answer: can this stock actually push through the $200 milestone, and when?

Why the $200 Barrier Still Feels Distant
Here is the sober part. Shares have gone almost nowhere over the past week, up just 0.09%, and the five-year return is still -21.84%. TGT last traded above $200 in 2021, and the market remembers the margin collapse that followed. Even after the rally, the stock sits 5% off its 52-week high of $170.75.
Investors also know the Q2 blowout was flattered by a $994 million pretax IEEPA tariff refund worth $1.65 per share. Strip that out and adjusted EPS still rose 20%, but the headline number is not fully repeatable. With a beta of 0.986, TGT is not going to lever a market rally into a moonshot.
Wall Street Sees 1% Downside. I Think They Are Behind the Curve
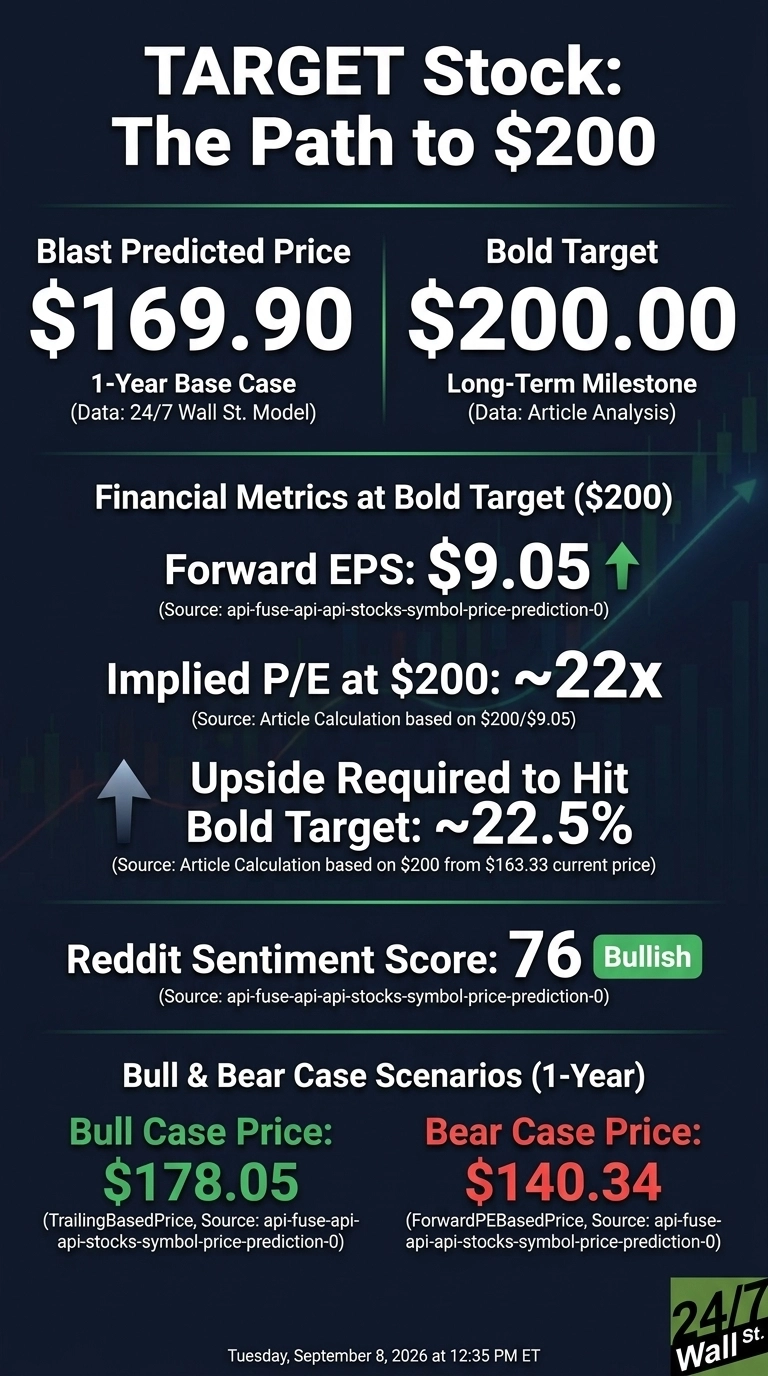
The consensus analyst target sits at $161.91, which is actually below today’s price. The ratings mix: 2 strong buy, 10 buy, 22 hold, 0 sell, and 4 strong sell. Our own model pegs a one-year base case of $169.90 with a bull case of $178.05 and a bear case of $140.34, confidence rated high at 0.9.
Only 32% of analysts are bullish, yet forward EPS estimates for fiscal 2027 have been revised sharply higher, from $8.386 thirty days ago to $10.228 today. That is a big gap between narrative and numbers, and history says numbers win.

Charting a Realistic Path to $200 Per Share
Reaching $200 from today’s price of $163.33 would require a gain of 22.5%. With forward EPS of $9.05, a price of $200 implies a forward P/E of 22x. Our base case of $169.90 already implies 19x, meaning the bold target requires roughly 3x of additional multiple expansion.
That is achievable if EPS keeps ratcheting higher, because the analyst consensus for fiscal year ending January 2027 already sits at $10.23. Our adjustment factor of 1.102 reflects strong earnings acceleration and bullish sentiment.
Fiddelke told investors, “When I think about healthy indicators of sustainable long-term growth, traffic is at the top of that list.” Traffic rose 3.6%, Roundel advertising grew nearly 20%, and Target Plus marketplace GMV grew more than 40%.
Our five-year bull case hits $202.77 on June 8, 2030. The primary risk is that discretionary spending weakens and the multiple compresses before EPS catches up.
Where Target Trades Today vs Its Earnings Power
At today’s price and forward EPS, TGT trades at roughly 18x forward earnings. That is not expensive for a business generating 15.4% trailing after-tax ROIC with a 2.78% dividend yield.
Shares sit between a 52-week low of $81.2 and a high of $170.75, and the 10-year return is 214.96%. If Fiddelke’s category resets in beauty, home, and food keep compounding, this multiple has room to expand rather than contract.

$200 Is a Stretch, But Here’s Why It’s Possible
To hit $200, TGT needs a 22.5% gain and a forward multiple around 22x. Realistic? Yes, on a multi-year view.
Three things need to go right: EPS revisions keep flowing higher, Roundel and Target Plus keep growing above 20%, and Fiddelke delivers the merchandising turnaround in apparel and home he says is a multi-year journey.
A consumer spending shock is what derails it. Returns at this level shouldn’t be expected every year, but we’ve outlined the blueprint for how Target could reach $200 in 2030.
Contact [email protected] for any questions or corrections.
Vandita Jadeja is a financial publisher with over a decade of experience writing about financial topics, including investment, savings, retirement, insurance and banking. Vandita is a Chartered Accountant who loves to debunk financial concepts for readers.
Her work has appeared on sites that include The Motley Fool, InvestorPlace, and Benzinga. She covers investing and focuses on stock picks and price prediction for 24/7 Wall St.
When not looking for the next stock investment opportunity, she can be found traveling, reading, chasing sunsets and enjoying her iced latte.