DraftKings After Earnings: Buy, Hold, or Run?
DraftKings just posted its worst margin quarter in years while simultaneously launching a business growing five times faster than its core sportsbook ever did. One of those stories is going to dominate the next 90 days, and the NFL season…

At $24.03, DraftKings (NASDAQ:DKNG | DKNG Price Prediction) is a hold. The Q2 report gave both sides fresh ammunition, and the stock’s sharp intraday round trip suggests the market is still working out which narrative wins.
DraftKings is the second-largest U.S. online sportsbook operator, with mobile sports betting live in 27 states, D.C., and Puerto Rico, iGaming in 5 states, and a newly launched Predictions platform competing with Kalshi and others in event contracts. The company posted its first full-year GAAP profit in 2025, then followed it with a Q2 2026 miss that reset expectations.
Revenue of $1.44 billion came in 4.48% below consensus, and adjusted EPS of $0.09 missed the $0.1917 estimate by 53.05%. Shares closed flat on the day after touching an intraday low of $21.895.
The Bull Case: Predictions Is Ramping Faster Than Sportsbook Did
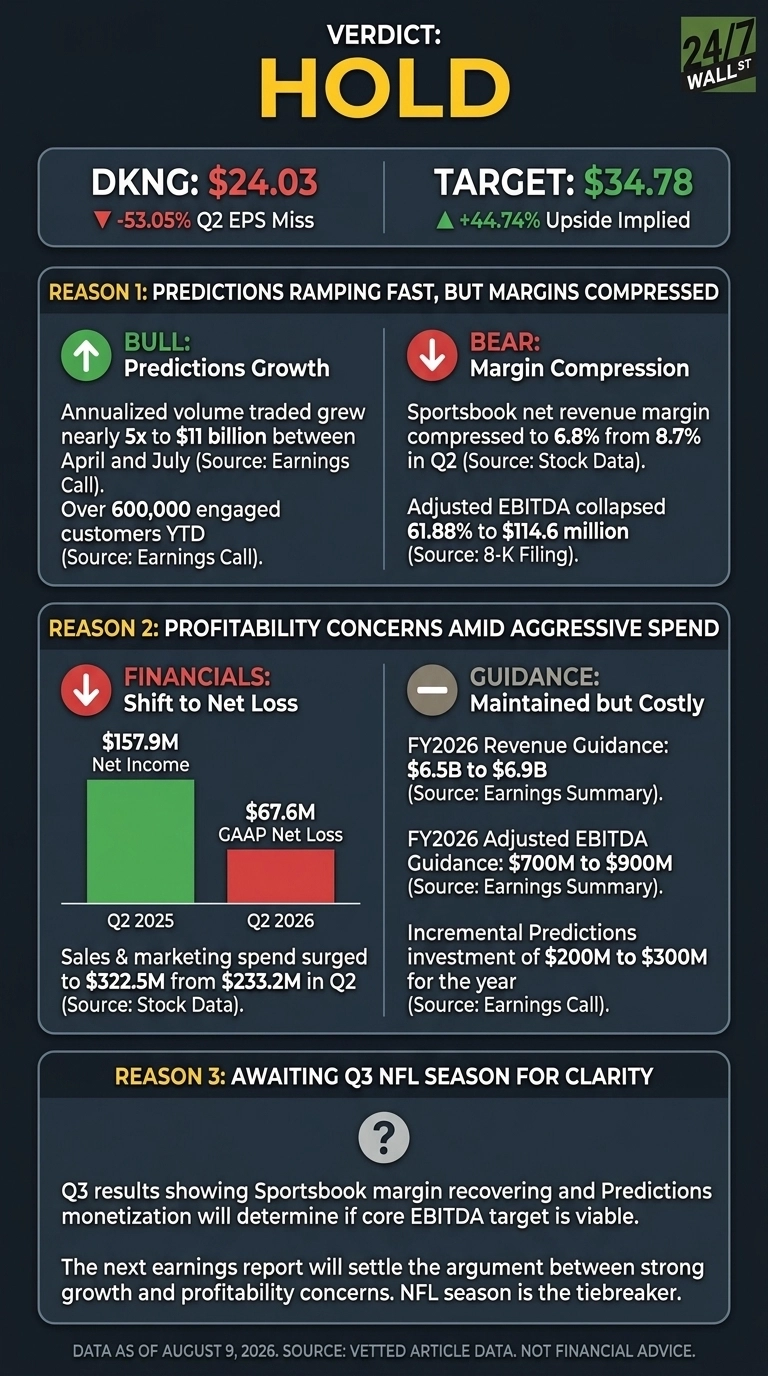
CEO Jason Robins said annualized Predictions volume grew nearly 5x from $2.3 billion to $11 billion between April and July, with over 600,000 customers engaged year-to-date at acquisition costs well below Sportsbook levels. The company owns the brokerage, the exchange, and the market maker in-house, capturing the full value chain.
Core metrics remain healthy. Sports consumer volume rose 15% year-over-year, monthly unique payers grew 9%, and July handle was up 20% year-over-year even after the World Cup ended. Management maintained full-year guidance of $6.5 billion to $6.9 billion in revenue and $700 million to $900 million in adjusted EBITDA. Wall Street is on board: 29 Buy ratings against 1 Sell.
The Bear Case: Margins Are Going the Wrong Way
The Q2 earnings report was ugly. Revenue fell 4.58% year-over-year, adjusted EBITDA collapsed 61.88% to $114.6 million, and the company swung to a GAAP net loss of $67.6 million from $157.9 million in net income a year earlier. Sportsbook net revenue margin compressed to 6.8% from 8.7%, and ARPMUP dropped roughly 13% to $132.
Marketing spend surged to $322.5 million from $233.2 million, and management flagged incremental Predictions investment of $200 million to $300 million for the year. Insider activity has been net selling across 93 recent transactions.
Regulatory risk around event contracts remains unresolved, and competition from FanDuel and Kalshi is intensifying as DraftKings spends aggressively to establish share.
The Hold Case: Two Real Stories, No Clean Resolution
Predictions growth and Super App traction are real, but they arrive alongside sport-outcome volatility that management said drove roughly $80 million of revenue headwind in the quarter. The 200-day moving average of $27.35 sits well above spot, but the 52-week low of $20.46 is closer than the high of $48.78.
The NFL season is the tiebreaker. Robins expects a huge back half, and history shows DraftKings has outperformed SPY in 30-day windows after both beats and misses. Another quarter of margin compression, or evidence that Predictions cannibalizes rather than expands the pie, would validate the bear thesis quickly.
The Data: Cheap on Cash Flow, Expensive on Earnings
DKNG trades at $24.03 against an analyst consensus target of $34.78, implying 44.74% upside if the target proves right. The forward P/E sits at 23x, price-to-sales at 1.9x, and free cash flow yield near 5.43%.
The analyst breakdown skews sharply positive:
- Strong Buy: 5
- Buy: 24
- Hold: 6
- Strong Sell: 1
Performance has lagged badly. DKNG is down 30.27% year-to-date and 46.84% over one year. In the 30 days after the Q1 beat, DKNG returned 22.48% while SPY returned -0.21%, showing the stock can move fast when the story shifts.
The Verdict: Wait for the NFL Data
At $24.03, DraftKings is a hold. The setup is genuinely balanced. Bulls have Predictions annualizing at $11 billion in traded volume, a nationwide Super App, and 44% upside to consensus. Bears have a 53.05% EPS miss, a 62% collapse in adjusted EBITDA, and a GAAP loss that erased last year’s profitability narrative. Both cases will be tested inside a single quarter.
The trigger to buy is straightforward: Q3 results showing Sportsbook margin recovering toward 8%, plus Predictions monetization converting 600,000 engaged customers into revenue at Sportsbook-like LTV. That would validate the $1 billion core EBITDA target and put the $34.78 consensus in play.
The trigger to sell is equally clear: another margin compression quarter, cuts to full-year EBITDA guidance, or evidence that Predictions promotional spend is not producing durable customers.
Options markets show a full-chain put/call ratio of just 0.20, suggesting positioning is not crowded on either side. Waiting one quarter for NFL-season data gives investors the single most important read on whether the Predictions ramp is real. Hold is the right call because the next earnings report will settle an argument the current price cannot.
Contact [email protected] for any questions or corrections.
Vandita Jadeja is a financial publisher with over a decade of experience writing about financial topics, including investment, savings, retirement, insurance and banking. Vandita is a Chartered Accountant who loves to debunk financial concepts for readers.
Her work has appeared on sites that include The Motley Fool, InvestorPlace, and Benzinga. She covers investing and focuses on stock picks and price prediction for 24/7 Wall St.
When not looking for the next stock investment opportunity, she can be found traveling, reading, chasing sunsets and enjoying her iced latte.