Costco’s Stock Has a Problem: It’s Almost Too Good
Costco runs one of the most airtight business models in retail, yet the stock is going nowhere fast. What happens when a near-perfect company runs out of room to surprise the market?


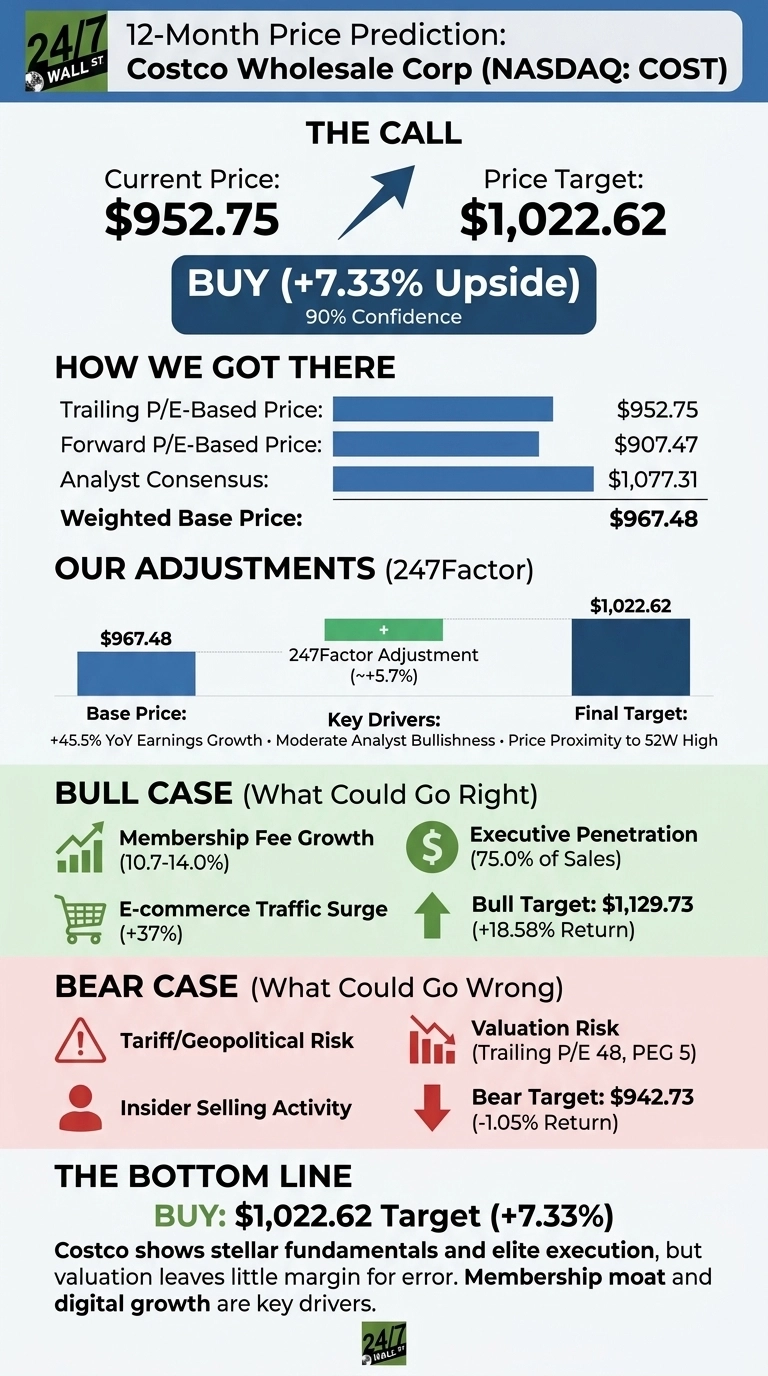
My 24/7 Wall St. price target for Costco (NASDAQ:COST | COST Price Prediction) lands at $1,022.62, a modest step up from today’s $952.75. The model rates COST a buy with 90% confidence, but upside is narrow. Costco executes at an elite level, and the market already knows it.
24/7 Wall St. Price Target Summary
| Metric | Value |
|---|---|
| Current Price | $952.75 |
| 24/7 Wall St. Price Target | $1,022.62 |
| Upside | 7.33% |
| Recommendation | BUY |
| Confidence Level | 90% |
A Flat Year Hiding a Strong Business
Costco shows stellar fundamentals meeting stalled price action. The stock is up 10.97% year to date but down 2.31% over the last year, trading about 2% below its 52-week high of $1,094.76 and well off the $840.35 low.
Fiscal Q3 2026, reported May 28, 2026, delivered EPS of $4.93 on revenue of $70.527 billion, up 11.58% year over year, with net income rising 15.19%. Comparable sales grew 9.8%, digital comps jumped 21.5%, and the worldwide membership renewal rate held at 89.7%.

The Case for $1,129 and Higher
Bulls have real ammunition. Our bull scenario points to $1,129.73, or an 18.58% total return. Membership fee income compounds at a 10.7% to 14.0% pace, executive membership penetration has climbed to 75% of sales, and e-commerce traffic surged 37% last quarter.
Warehouse count targets 940 by fiscal year-end. The Street’s consensus target of $1,077.31, backed by 4 Strong Buy and 19 Buy ratings, reflects that conviction.

What Could Go Wrong
The bear case takes COST to $942.73, a 1.05% loss. At a trailing P/E of 48 and a PEG of 5, valuation leaves no margin for a soft quarter. Tariff pressure, FX volatility, and rising wages remain live risks flagged in the 10-Q. Insider activity has skewed to selling.
Heavy capex on warehouses and distribution suppresses near-term free cash flow, though Costco’s 29.1% return on equity argues reinvestment earns its keep.
How Costco Compares to Walmart and BJ’s
Walmart (NYSE:WMT) is the direct scale comp. WMT trades at a P/E of 41 with a market cap of $896.56 billion, growing revenue at 6.1% in Q1 FY2027. Costco trades at a P/E of 48 while growing revenue nearly twice as fast, supporting the premium.
BJ’s Wholesale Club (NYSE:BJ) is the closest membership-model peer. BJ posted 9.86% revenue growth in Q1 FY2027 with a 90% tenured member renewal rate, on a market cap of $12.28 billion. The membership economics validate Costco’s model, but BJ’s smaller footprint underscores why COST commands scarcity value.
| Company | P/E Ratio | Market Cap |
|---|---|---|
| Costco | 48 | $420.3B |
| Walmart | 41 | $896.6B |
| BJ’s | N/A | $12.3B |
Quality Compounder at a Full Price
The 24/7 Wall St. price target of $1,022.62 is a buy with 90% confidence, but 7.33% upside is modest. Membership fee income and renewal rates form retail’s closest subscription moat.
The 200-day moving average sits near $958.09, a level worth watching. Key signals to monitor include comp sales growth holding above 5% and continued margin expansion.
Extending the model assumes current comp-sales momentum and membership economics persist.
| Year | 24/7 Wall St. Price Target |
|---|---|
| 2026 | $1,022 |
| 2027 | $1,085 |
| 2028 | $1,150 |
| 2029 | $1,215 |
| 2030 | $1,279 |
These assume roughly 30 warehouses annually and renewal rates near 90%. Digital penetration gains offer upside, while tariff shocks or membership fatigue could compress multiples toward the bear-case $1,066.95 five-year outcome.
Contact [email protected] for any questions or corrections.
Vandita Jadeja is a financial publisher with over a decade of experience writing about financial topics, including investment, savings, retirement, insurance and banking. Vandita is a Chartered Accountant who loves to debunk financial concepts for readers.
Her work has appeared on sites that include The Motley Fool, InvestorPlace, and Benzinga. She covers investing and focuses on stock picks and price prediction for 24/7 Wall St.
When not looking for the next stock investment opportunity, she can be found traveling, reading, chasing sunsets and enjoying her iced latte.