SpaceX Closes In on $150 as 2 Rockets Launch Back-to-Back
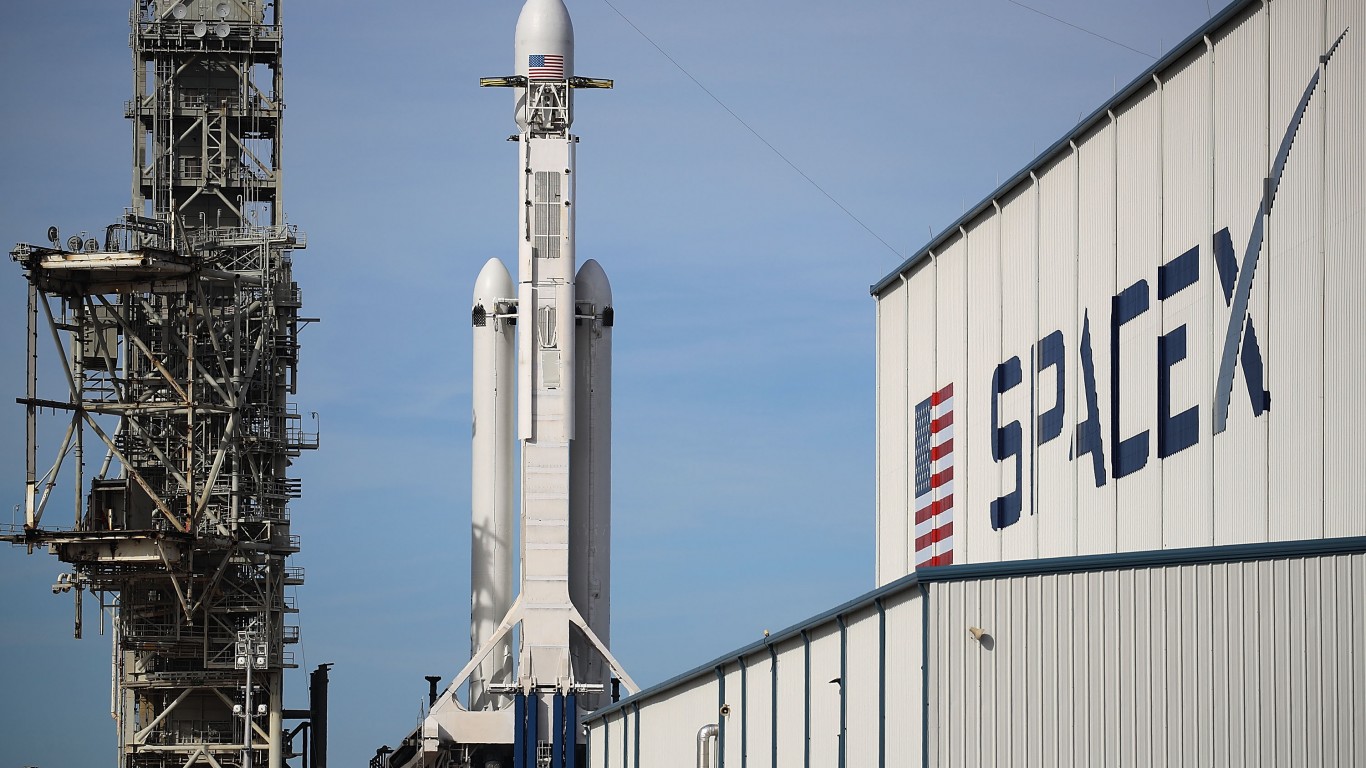
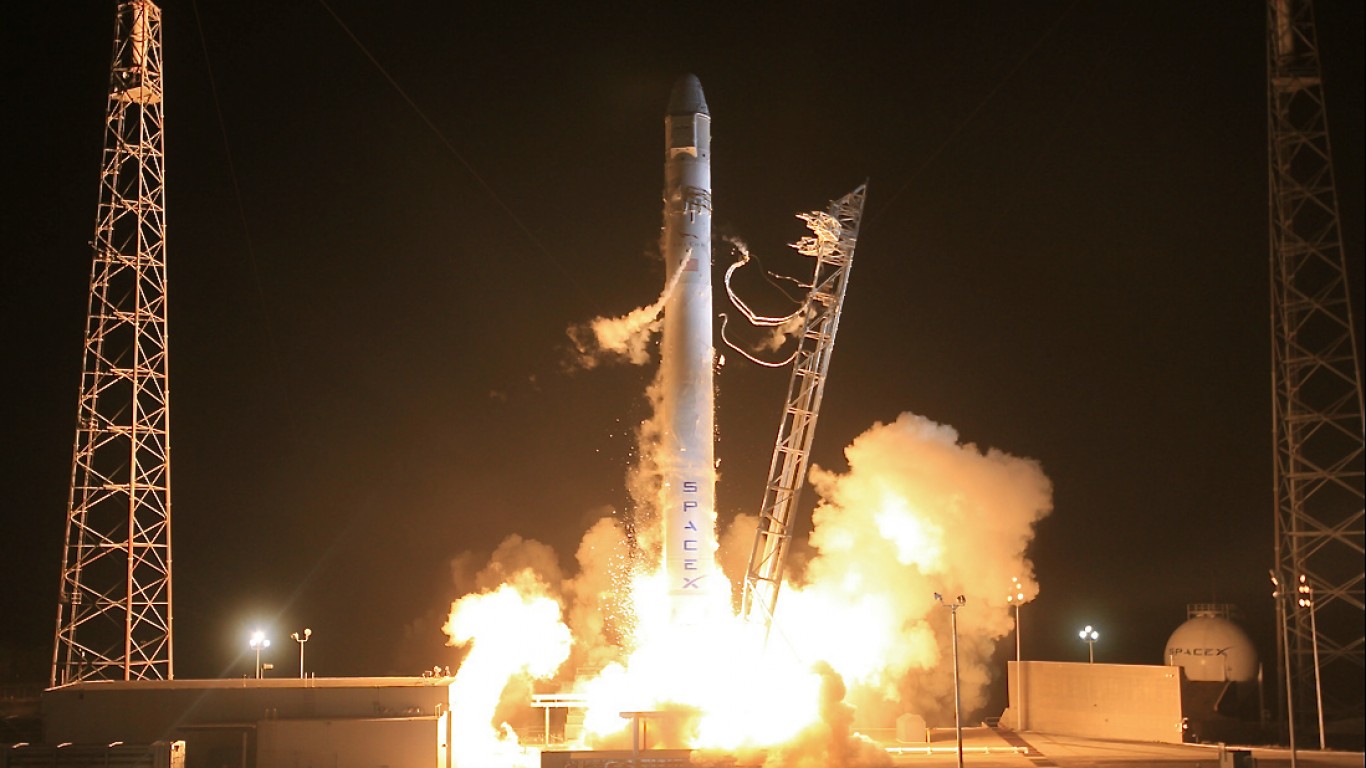
Two Falcon 9 rockets launched within 38 minutes of each other over the weekend, and now SpaceX shares are knocking on a price level that Polymarket gives less than even odds of holding by month end.

The Number
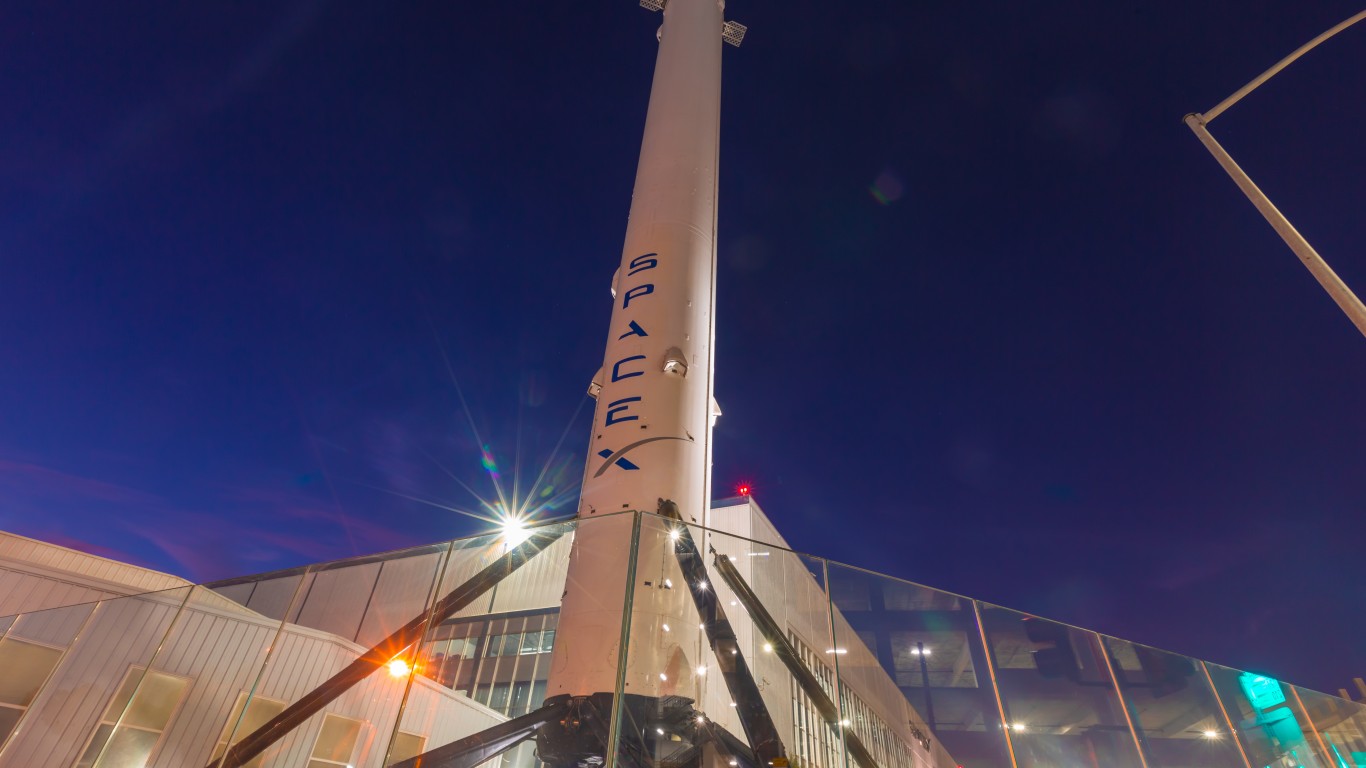
The back-to-back Falcon 9 launches by SpaceX (NASDAQ:SPCX | SPCX Price Prediction) over the weekend set a fresh cadence record and showcase how quickly the launch infrastructure is scaling. The longer-term thesis, however, hinges on Starship achieving full and rapid reusability with quick turnarounds.
The stock priced its IPO at $135, opened at $150, and briefly touched roughly $226 before sliding to a low of $104.83. Since the 8-K filing at $115.09, shares have recovered materially. Polymarket contracts assign an 89.5% probability SPCX touches $150 this week and a 46.5% probability it closes above that level by month end.
Shares traded at $149.16 midday Monday, up 6.54% intraday from a prior close of $140, after the company launched two Falcon 9 rockets within 38 minutes, one carrying a GSAT payload and the other flying for the U.S. Space Force.
What It Means
SpaceX posted $7.814 billion in Q2 2026 revenue, disclosed in the 8-K filed on August 4, 2026. The figure topped the consensus estimate of $6.82 billion by 14.59% and represented 92% year-over-year growth from the prior-year quarter’s $4.1 billion.
The top line was carried by three engines pulling at different speeds. Connectivity generated $4.291 billion, up 66% year over year, with Starlink’s subscriber base doubling to 12.0 million and Enterprise & Government revenue climbing 108%. The AI segment delivered $2.561 billion, growing 247%, while Space contributed $962 million. Adjusted EBITDA reached $3.54 billion, up 191% YoY, though the company still booked a $541 million net loss as capital expenditures hit $18.37 billion, with $15.83 billion funneled into AI compute infrastructure.
Strategic Outlook
Management is guiding to a $100 billion annualized revenue run rate by December 2026, propelled by $6.7 billion in newly contracted cloud services revenue, over $6 billion in U.S. government Starshield contracts, and the pending $60 billion Cursor acquisition. Compute capacity reached 1.4 gigawatts, with a target of over 2 GW by year-end. Backlog stands at $47.5 billion, and cash sits at roughly $100 billion after a $25 billion investment-grade bond raise.


Bottom Line
SpaceX carries a market cap near $1.96 trillion, and hitting the $100 billion ARR commitment implies roughly $8.3 billion in monthly revenue by December. Q2 2026 averaged about $2.6 billion per month, so the ramp is steep. Analyst consensus sits at $227 with 27 Buy, 6 Hold, and 2 Sell ratings. Investors can cheer the launch cadence, but keep an eye on the stock into the next Starship test flight and Q3 disclosures on Cursor’s close and cloud services ramp.

Contact [email protected] for any questions or corrections.
After two decades of patrolling the dark corners of suburbia as a police officer, Rich Duprey hung up his badge and gun to begin writing full time about stocks and investing. For the past 20 years, he’s been cruising the markets looking for companies to lock up as long-term holdings in a portfolio while writing extensively on the broad sectors of consumer goods, technology, and industrials. Because his experience isn’t from the typical financial analyst track, Rich is able to break down complex topics into understandable and useful action points for the average investor. His writings have appeared on The Motley Fool, InvestorPlace, Yahoo! Finance, Money Morning, and, of course, 24/7 Wall St. He has been featured in both U.S. and international publications, including MarketWatch, Financial Times, Forbes, Fast Company, and USA Today.