





Walmart (NASDAQ:WMT | WMT Price Prediction) has cooled after a strong spring run. The question is whether the stock can push back through the $140 level it touched earlier this year. Our proprietary model says patience will be rewarded, though the path likely stays choppy.
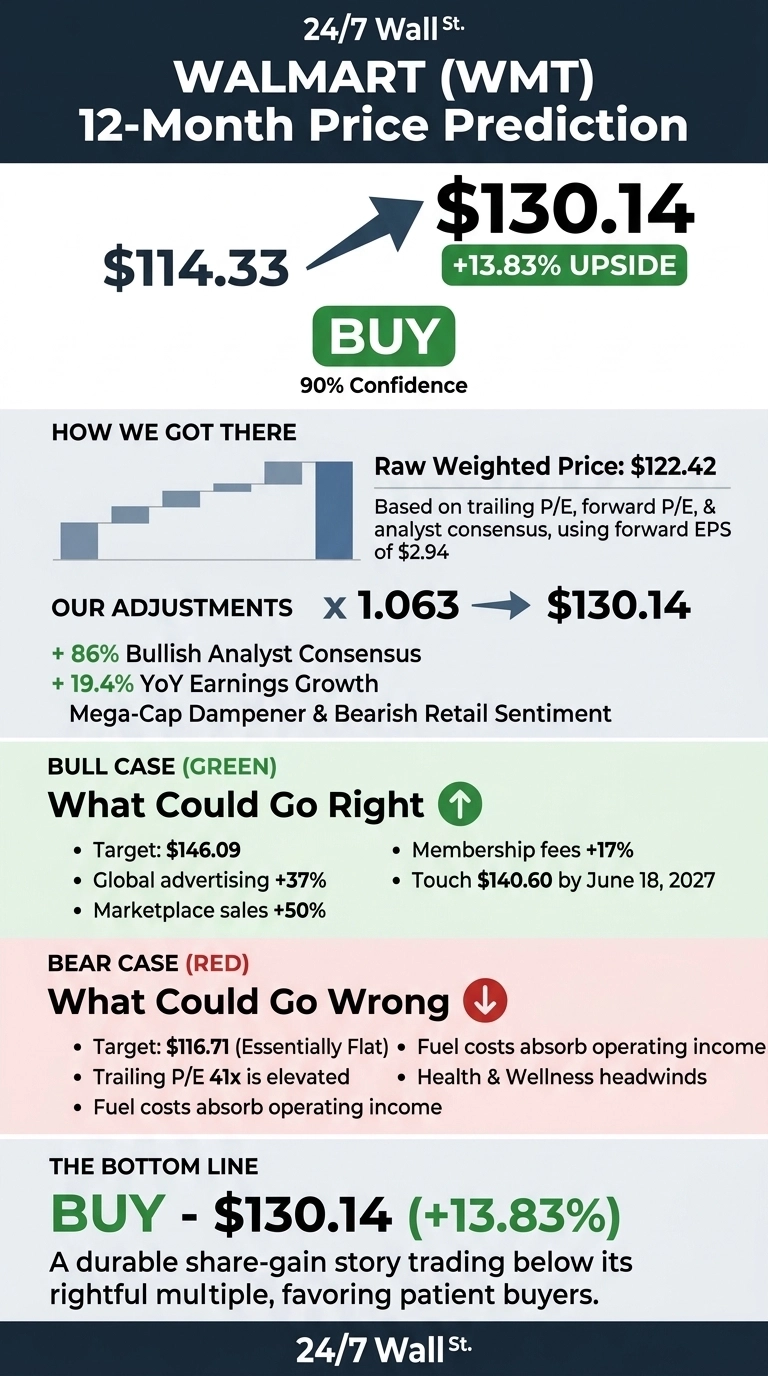
The 24/7 Wall St. price target for Walmart is $130.14 over the next 12 months, implying 13.83% upside from the current $114.33 quote. We rate the stock a buy with 90% confidence.
24/7 Wall St. Price Target Summary
| Metric | Value |
|---|---|
| Current Price | $114.33 |
| 24/7 Wall St. Price Target | $130.14 |
| Upside | 13.83% |
| Recommendation | BUY |
| Confidence Level | 90% |
The Pullback From May Highs
Walmart peaked around $131.45 in mid-May 2026 before drifting to $112.53 by mid-July. Shares have since firmed, gaining 1.48% over the past week and 15.02% over the past year. The 52-week range sits at $94.85 to $135.16.
The catalyst was Q1 FY27, released May 21. Adjusted EPS of $0.66 narrowly beat, and revenue of $175.68 billion grew 6.08%, but shares dropped 7.27% as fuel costs absorbed roughly $175 million of operating income and free cash flow swung to negative $1.9 billion on elevated capex.

The Case for $140 and Beyond

Our bull scenario projects Walmart at $146.09 in one year, with the stock touching $140.60 by June 18, 2027. The engine is the high-margin flywheel: global advertising grew 37%, marketplace sales climbed nearly 50%, and membership fees rose over 17%. Advertising and membership now represent roughly one-third of operating income.
CFO John David Rainey told analysts he is “probably as excited about the potential of our business today as at any point in time in the last few years.” The analyst consensus price target sits at $137.97, with 28 Buy and 9 Strong Buy ratings backing the setup.

What Could Go Wrong
Our bear case tags WMT at $116.71 in a year, essentially flat. The valuation sits at a premium: trailing P/E of 41 is elevated for a business with a 3.07% net margin. Fuel costs, IEEPA tariff uncertainty, and a roughly 700 basis point headwind in Health & Wellness from Maximum Fair Pricing pressure operating income. Inventory rose 8.9%, and ROI slipped 40 basis points to 14.9%.
Bulls counter that negative free cash flow reflects deliberate capex of approximately 3.5% of net sales to automate fulfillment, and fuel headwinds are exogenous, tied to commodity swings rather than the operating model.
How Walmart Compares to Costco and Target
Costco Wholesale (NASDAQ:COST) offers the cleanest valuation contrast. Costco trades at trailing P/E of 48 and forward P/E of 42, both premiums to Walmart, on quarterly revenue growth of 21.5%. If the market pays 48 times earnings for Costco’s membership model, our 41 times multiple on Walmart looks reasonable.
Target (NYSE:TGT) sits on the other end. FY26 revenue fell 1.68% to $104.78 billion, and full-year adjusted EPS of $7.57 declined year-over-year. That share loss is Walmart’s gain, especially the strongest general merchandise share growth in five years. The peer group makes our $130.14 target look conservative.
Walmart Price Prediction 2026 to 2030
The 24/7 Wall St. price target of $130.14, our buy rating, and 90% confidence reflect a durable share-gain story trading below its rightful multiple after a fuel-driven earnings dip.
The thesis rests on advertising, membership, and marketplace growth compounding faster than core retail. The main risks are tariff and Maximum Fair Pricing pressure extending through FY28. The setup favors patient buyers.
Extending the model using the base-case 9.04% annualized return path through 2031:
| Year | 24/7 Wall St. Price Target |
|---|---|
| 2026 | $122 |
| 2027 | $137 |
| 2028 | $150 |
| 2029 | $163 |
| 2030 | $176 |
These projections assume Walmart continues executing on omnichannel, advertising, and membership. Significant upside or downside could result from tariff resolution or a sharper consumer slowdown.
Contact [email protected] for any questions or corrections.











 Top Gaining Stocks
 Top Losing Stocks