Dan Niles Warns The the 10-Year Treasury Is Headed to 6%, A Level Not Seen Since The Height Of The Dot-Com Bubble
The Fed has not moved its policy rate in months, yet long-term borrowing costs keep climbing on their own, and one prominent fund manager sees a level not touched since the dot-com era as the next stop, with serious consequences…


The Federal Reserve has not touched its policy rate since December, yet long-term borrowing costs in the United States have been running their own tightening cycle. The federal funds target upper bound has been pinned at 3.75% since December 11, 2025, sitting 0.75 points below where it was a year ago. Over the same stretch, the 10-year Treasury yield has moved in the opposite direction, climbing from a low of 3.97% on February 27, 2026 to 5.00% on September 15, 2026. That reading sits in the 99.6th percentile of the last year’s range.
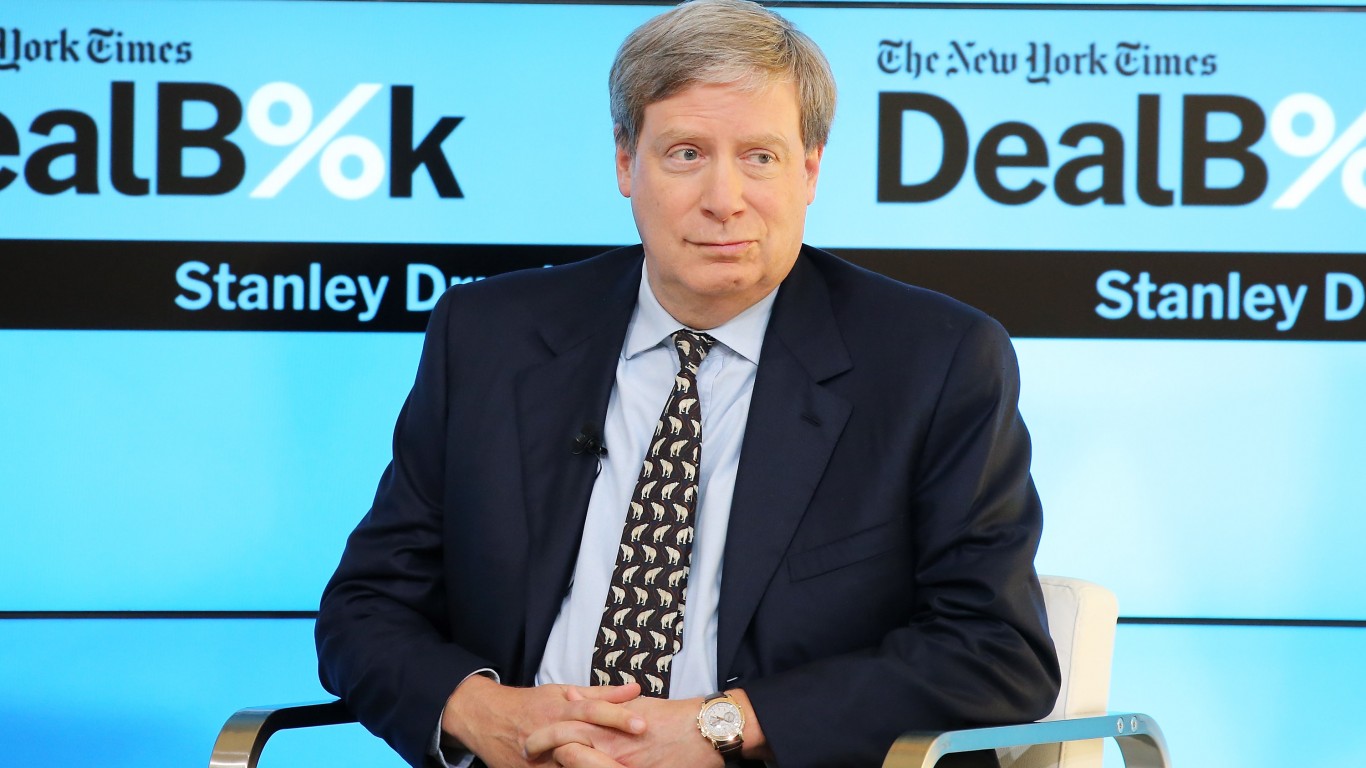
Dan Niles, who runs Niles Investment Management, thinks the bond market is not finished. In a September 15 appearance on CNBC’s Squawk on the Street, Niles argued that the next Fed move looks like a hike and that a 6% terminal yield on the 10-year is plausible. He grounds the call in structural fiscal math: deficits running at roughly 6% of GDP, about $40 trillion in federal debt against $33 trillion of GDP, and hyperscalers now competing directly with the Treasury to issue paper.
Bond Market Already Ran Its Own Hiking Cycle
Niles’ framing is that the Fed “let the market kind of dictate where rates want to go,” which is why the classic “don’t fight the Fed” rule now cuts against equities even with the Fed standing still. His playbook: don’t fight the Fed, don’t fight the bond market, and don’t fight seasonality. On that last point, he cites a median 10% drawdown from the end of July through November 9 in midterm years, roughly double the non-midterm average, and says he is carrying a lot of shorts into that window.
Jim Cramer echoed the same warning four days earlier. On the September 11 episode of Mad Money, Cramer told viewers that if the Fed tightens, bulls will be fighting the Fed, and he advised being sparing with cash. Two voices, one message: tightening is happening in the long end whether or not the FOMC ratifies it.
What A 6% 10-Year Would Actually Break
The yield curve is already flashing the setup. On September 15, the 20-year printed 5.40% and the 30-year 5.36%, with the long end above 5%. A push to 6% on the 10-year would drag 30-year fixed mortgages meaningfully higher, reprice investment-grade and high-yield corporate spreads, and lift the risk-free rate used to discount every equity cash flow. Growth stocks with long-dated earnings streams take the biggest hit to present value when the discount rate jumps.

That is the connective tissue to Meta (NASDAQ:META | META Price Prediction). Meta is arguably the most exposed mega-cap to a rising long rate for two reasons: valuation and financing. The company guided full-year 2026 capex to $130 to $145 billion, up from a $115 to $135 billion range at the Q4 2025 report, and raised long-term debt to $83.66 billion to fund the AI buildout. Q2 2026 capex alone was $30.12 billion, up 82% year over year, and free cash flow collapsed to $784 million from $8.55 billion. Higher yields raise the marginal cost of financing that buildout and compress the multiple the market will pay for it.
Multiples, Not Just Coupons
Meta trades at a P/E of 24 with a market cap near $1.497 trillion. Shares are up 15.3% over the past month even as the 10-year has jumped, and up 3.21% year to date. Niles is long Meta at roughly 17 times calendar 2027 earnings, calling out cleared litigation overhangs and monetization gains against 3.60 billion Family DAP. That is a name-specific view inside an otherwise bearish book.

The broader takeaway for investors: the next scheduled FOMC-related release date is September 16, 2026. Whatever the Fed signals, the tightening that matters for mortgages, CD yields, and equity multiples is happening in the long end of the curve. Niles is betting there is another full point to go.
Data Sources
- Niles: 10-year headed to 6% (CNBC, Sep 15, 2026): used for Niles’ 6% forecast, deficit and debt figures, hyperscaler debt-competition argument, midterm drawdown statistic, and his Meta long thesis.
Contact [email protected] for any questions or corrections.
AJ spent 10 years writing about financial markets at The Motley Fool. His coverage centers on technology stocks and the broader macroeconomic trends, from interest rates to geopolitics, that shape where markets are headed next. AJ is drawn to the stories where big-picture economics and individual companies collide.