Best Buy’s 4.2% Yield Looks Attractive. Can the Dividend Survive a Bad Year?
Best Buy has raised its dividend every year since 2015 and currently yields 4.2%, but a soft consumer year once pushed coverage to the razor's edge. Here is what the cash flow record reveals about whether that quarterly check holds…

This post may contain links from our sponsors and affiliates, and Flywheel Publishing may receive compensation for actions taken through them.
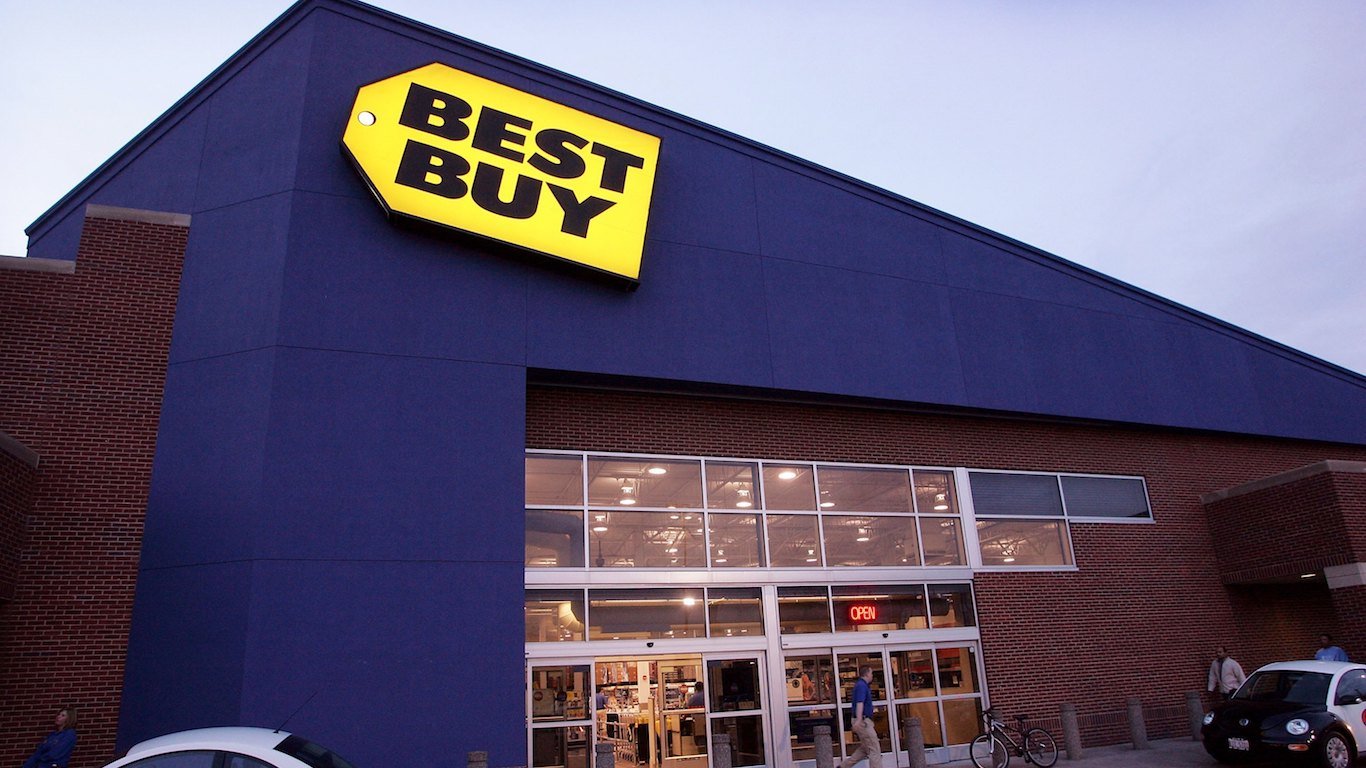
Best Buy (NYSE:BBY | BBY Price Prediction) sells TVs, laptops and phones in a category pressured by online rivals. Yet the checks keep arriving. The stock yields 4.2% on a forward annual payout of $3.84, with the next $0.96 payment due October 8, 2026. For an income investor, the question is whether that payout survives a bad year.

Free Cash Flow Covers Every Dollar of the Dividend
Free cash flow is the cash left after store and technology spending, and it is what actually funds a dividend. In fiscal 2026, Best Buy generated $1.258 billion of free cash flow from $1.962 billion of operating cash flow, while dividends cost $801 million. Buybacks also continued at $273 million.
Earnings point the same way. Management raised fiscal 2027 adjusted EPS guidance to $6.70 to $6.90, up from $6.30 to $6.60, well above the $3.84 annual dividend. Second-quarter adjusted EPS of $1.47 beat the $1.36 consensus, the 5th consecutive beat.

“We drove growth across almost all our major product categories as well as continued strong performance in our Best Buy Ads and Marketplace initiatives.”
Best Buy Ads is on track for 10% growth on $900 million in collections last year, and marketplace GMV guidance rose to $1.3 billion. Higher-margin revenue supports the dividend beyond hardware.
Balance Sheet Cushion Gets Tested Every Fall
Best Buy held $2.255 billion in cash at the end of July, up 31.64% year over year. Total debt of $4.133 billion is mostly lease obligations of $2.964 billion, with long-term debt at $1.158 billion.
Retail cash flow is seasonal. Holiday inventory built up. Operating cash flow was negative $99 million in the quarter ending October 2025, then moved to $1.278 billion the next quarter. A soft consumer year looks like fiscal 2024: operating cash flow fell to $1.47 billion, capital spending was $795 million, and dividends cost $801 million. Coverage got thin, and the company raised the quarterly rate anyway. Buybacks are the flexible tool: Best Buy bought back just $36 million last quarter against a roughly $300 million full-year plan.
A Decade of Raises, Now Growing Slowly
Dividend records go back to 2003. The regular quarterly rate has stepped up every year since 2015, from $0.23 to today’s $0.96, with no cut over that stretch. The big jump came in 2022, from $0.70 to $0.88. Since then, raises have fallen to cents: $0.92, $0.94, $0.95, then a 1% bump in March 2026.
Consider Target (NYSE:TGT) first. It is a Dividend King with a far longer record of annual increases, and Amazon (NASDAQ:AMZN) pays no dividend and reinvests its capital. Best Buy sits between them: a genuine income stock with a shorter streak.

Leadership changes hands on November 1, 2026, when Jason Bonfig becomes CEO. His stated priority:
“It is about making sure we grow revenue, keep our customers, and improve the rate over time.”
Verdict: Built to Last, With Slow Growth Ahead
This dividend is durable. Free cash flow, raised earnings guidance, a growing cash pile and a flexible buyback provide protection, so an income investor can reasonably trust the $0.96 quarterly check while expecting small raises. Watch annual free cash flow against roughly $801 million in yearly dividend payments. If free cash flow falls below that line for more than one year, the answer changes.
Contact [email protected] for any questions or corrections.
Chris Lange is a financial and geopolitical writer with more than a decade of experience covering a myriad of topics. He has published thousands of articles for 24/7 Wall St., with past coverage focused heavily on stocks, IPOs, healthcare, defense, global affairs, and technology.
His work has been quoted, or referenced by a number of outlets including Business Insider, USA Today, Yahoo Finance, MSN, The Motley Fool, and many other publications. A graduate of Southwestern University, he studied business with a focus on investments and has previous experience in banking and startups.
When not reading or writing the news, he is following his passion for Lacrosse, playing chess, or building solar projects with his dad.