Prediction: Figma Stock Set for 25% Upside
Figma shares sit near a 52-week low even as revenue growth keeps accelerating, leaving a glaring gap between price and fundamentals that either signals a rare buying opportunity or a warning investors are missing something critical.


Figma (NYSE:FIG) is heavily sold despite accelerating growth. Shares trade at $20.16. The 24/7 Wall St. price target sits at $25.23 over the next 12 months, meaning 25.1% upside. Rating: Buy with moderate confidence.
| Metric | Value |
|---|---|
| Current Price | $20.16 |
| Price Target from 24/7 Wall St. | $25.23 |
| Upside/Downside | 25.1% |
| Recommendation | BUY |
| Confidence Level | 60% |
Figma has an unusual financial profile for software. Revenue grew 48% in Q2 while posting a 14% free cash flow margin. Few companies its size combine that growth rate with self-funding cash generation. The stock trades near its 52-week low, creating a gap between price and fundamentals.
A 46% Slide in 2026 Masks Growth That Keeps Speeding Up
Figma is down 46.05% year to date, with a 52-week range from $16.60 to $71.48. Enterprise software stocks generally traded lower on September 22, adding pressure.
The business points the other way. Q2 revenue reached $370 million, the third consecutive quarter of accelerated growth. Net dollar retention was 136% and gross margin was 85%. Management raised full-year guidance by $40 million to $1.463 billion to $1.467 billion.
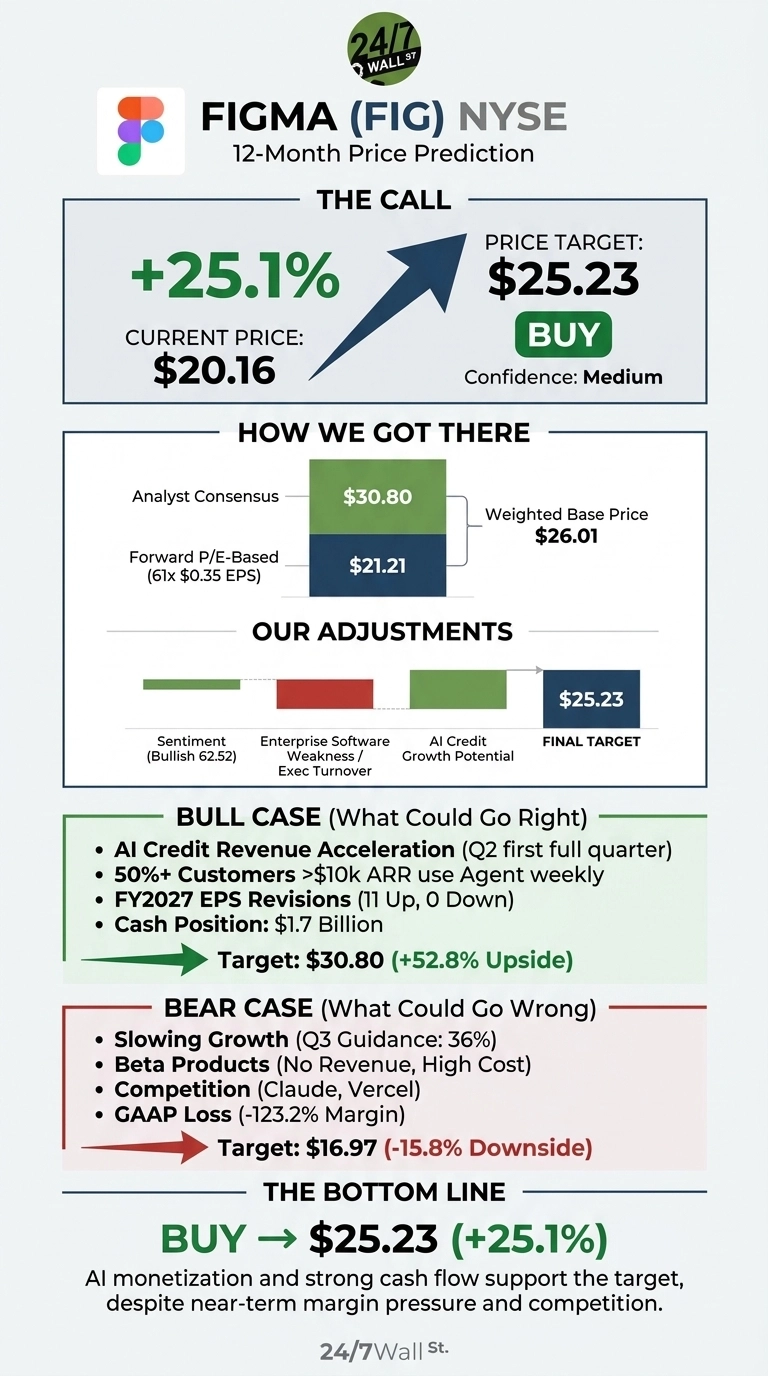
Sentiment is bullish at 62.52, but analysts made 4 downward EPS revisions for Q3 and Q4 over the past 30 days. Enterprise software sentiment is weak and the executive team is turning over.
Why Bulls See a Path to $30.80
AI credits are the main driver. Q2 was the first full quarter in which AI credit revenue added to results. More than 50% of customers paying over $10,000 annually already use Figma Agent weekly. Beta products such as Code Layers and Motion do not yet consume paid credits.
Customers paying more than $100,000 in annual recurring revenue grew 46%. The CEO said that Figma’s strengths are “even more valuable in a world where code is a commodity and value is moving up the stack.”
FY2027 EPS estimates saw 11 upward revisions with no cuts over the past 30 days. If Figma hits the high estimate of $0.44 at a 70x multiple, the stock reaches $30.80, or 52.8% upside. Analyst ratings: 1 Strong Buy, 4 Buy, 9 Hold.
What Could Drag Figma Back Toward $17
Q3 guidance meaning 36% growth, a slowdown as Figma moves past March 2025 pricing changes. Beta products create inference costs with no offsetting revenue, squeezing gross margin. Competitors include Claude Design, Vercel and vibe-coding platforms.
GAAP profit margin is -123.2%. Non-GAAP Q2 operating income was $36 million and free cash flow was $53 million. If the bear scenario plays out, EPS hits the low estimate of $0.28 at 61x, giving $16.97, or 15.8% downside.
Is Figma Pricier Than Adobe and Atlassian?
Adobe (NASDAQ:ADBE | ADBE Price Prediction) is Figma’s most direct competitor. It trades at about 9x forward earnings with 12.9% revenue growth.
Atlassian (NASDAQ:TEAM) sells collaboration software to the same teams at 36x forward earnings. Figma’s price-to-sales ratio is only slightly above Atlassian’s despite much faster growth, making our target reasonable.
| Company | Forward P/E | Revenue Growth (YoY) | Price/Sales |
|---|---|---|---|
| Figma | 61 | 48.2% | 8.67 |
| Adobe | 9 | 12.9% | 3.60 |
| Atlassian | 36 | 27.6% | 7.23 |
Figma Price Prediction 2026-2030
Our price target of $25.23 supports a buy rating with 60% confidence. Figma’s $1.7 billion cash position and positive free cash flow make the case.
The bull case strengthens if beta products move to paid credits and net retention stays near 136%. The setup weakens if Q3 revenue falls short of $373 million to $375 million guidance.
Our model projects prices assuming current growth trends hold and consensus EPS growth of about 21.8% in FY2027, then assumes growth slows annually after that.
| Year | Price Target from 24/7 Wall St. |
|---|---|
| 2026 | $25.23 |
| 2027 | $30.28 |
| 2028 | $35.73 |
| 2029 | $41.44 |
| 2030 | $47.24 |
Contact [email protected] for any questions or corrections.
Vandita Jadeja is a financial publisher with over a decade of experience writing about financial topics, including investment, savings, retirement, insurance and banking. Vandita is a Chartered Accountant who loves to debunk financial concepts for readers.
Her work has appeared on sites that include The Motley Fool, InvestorPlace, and Benzinga. She covers investing and focuses on stock picks and price prediction for 24/7 Wall St.
When not looking for the next stock investment opportunity, she can be found traveling, reading, chasing sunsets and enjoying her iced latte.