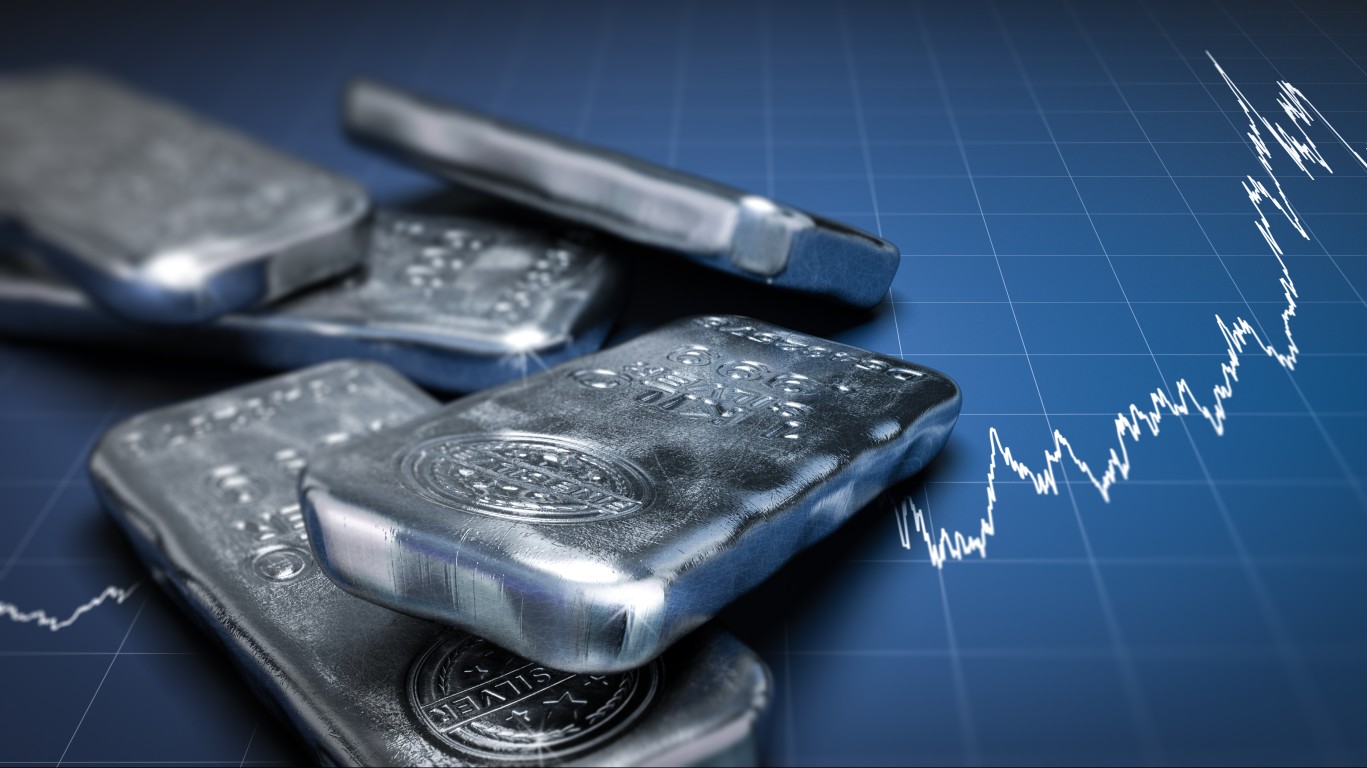
Gold Lost $100 an Ounce in Hours After the Inflation Report
Gold is supposed to surge when inflation runs hot, but on the day a surprise CPI report rattled markets, the metal cratered instead. The reason traces back to a single number the Federal Reserve is watching very closely.

At 12:50 p.m. Eastern on October 14, 2026, a widely followed markets account posted that spot gold had extended losses to “nearly -$100/oz today, now trading below $4,100/oz.” A September inflation report came in hotter than expected, with the Consumer Price Index rising 0.6% in a single month.
Most retirement investors were taught that gold protects you when prices rise, yet the metal fell hardest on the day inflation surprised to the upside.
Gold recovered part of the drop and sat at $4,098.80 in late US trading, down $61.30, or 1.47%. SPDR Gold Shares (NYSEARCA:GLD) fell 1.49% to $375.99, tracking the metal closely.
If you own the fund, the question is whether one session changes the case for holding it, and the answer depends less on inflation than on the dollar and the Federal Reserve’s next move.
Why a Hot Inflation Report Sank the Inflation Hedge
Gold pays no interest or dividend, so its real competition is the yield on cash and Treasuries. When an inflation surprise raises the odds of a rate hike, that competition improves faster than inflation fear builds.
Money markets lifted the odds of an October hike from roughly 22% a day earlier to about 42%. The Fed’s target rate is already at an upper bound of 4.00%, up from 3.75% in mid-September, so the central bank has already shown it will tighten.
Yields rose with those odds, with the 10-year Treasury at 5.251% and the 2-year at 4.865%. The US Dollar Index gained 0.69% to 102.90, its strongest level in roughly a year and a half, which makes dollar-priced gold more expensive for foreign buyers.
Silver also dropped about 6% right after the report and stood at $55.41 in late trading, down 6.16%. The iShares Silver Trust (NYSEARCA:SLV) fell 6.11% to $50.22.
Silver carries heavy industrial demand and trades in a far thinner market than gold. That combination makes it act like a leveraged version of the same rate trade, falling harder when yields jump and rallying harder when they ease.
GLD’s 52-week range runs from $360.12 to $509.70, and the fund closed much closer to the bottom. A dollar that keeps climbing for weeks is a bigger threat to the fund than any single session.
Several things could each reverse the move. These include lower energy prices in the next inflation report, a Fed that signals patience over a hike, or a credit scare that sends money into metal regardless of yield. Until one appears, gold is trading as a rate asset first and an inflation hedge second.
Should You Buy or Sell GLD ETF
GLD can work as a modest slice of a retirement portfolio, held as a cushion against currency or credit shocks. The fund holds physical bullion, charges a 0.4% expense ratio, and sits near the low end of its yearly range after a selloff driven by rate expectations, which can reverse quickly.
Coins and bars avoid the fee but add dealer markups, storage, and insurance. Miners offer more upside, although they carry operating risk and usually fall further than the metal in sessions like this one.
The Fed’s October decision is the trigger to watch. A hike, coupled with a Dollar Index holding above 102.90, would weaken the case for the fund, while a pause would likely lift GLD back above $381.67, where it started the October 14 session.
Contact [email protected] for any questions or corrections.
Omor Ibne Ehsan is a writer at 24/7 Wall St. He is a self-taught investor with a focus on growth, cyclical, and dividend equities that have strong fundamentals, value, and long-term potential. He also has an interest in high-risk, high-reward investments such as penny stocks.